Research
48 pages
Asset Allocation of Sovereign Wealth Funds
On this page
Sovereign wealth funds managed about $11 trillion by 2023, and the literature has largely treated them as one category. They are not one category. A savings fund preserving wealth across generations, a stabilization fund smoothing fiscal volatility, and a strategic fund financing national development have different mandates, different cash-flow obligations, and — as this dissertation shows — systematically different portfolios.
The work compares four commodity-backed funds in matched pairs: PIF against Samruk Kazyna for strategic funds, the Alaska Permanent Fund against SOFAZ for stabilizing ones. Five hypotheses are tested against thirteen funds' data.
The headline result concerns home bias. It is one of the most cited regularities in the SWF literature — and it dissolves once fund type is controlled for: almost all domestic investment is done by strategic funds, for which investing at home is the stated objective, and almost none by savings or stabilizing funds, for which it would contradict theirs.
The full text is below, typeset from the submitted version. Both language versions are available as PDFs.
Sovereign Wealth Funds (SWFs) have become major players in the global economy, with their assets under management totaling $11 trillion as of 2023. These funds vary greatly in their objectives, functions, governance structures and investment approaches, largely due to their roles in economic policy making of their respective governments. Previous studies on SWFs have not adequately differentiated among the different types of SWFs. This research advances the understanding of SWFs by considering the distinct characteristics of various SWF types and examining their investment strategies on an individual basis, using a case study approach. Our findings reveal strong links between the nature of a fund and its asset allocation. Based on theoretical developments we also form recommendations for several funds with regard to their asset allocation.
Keywords: Sovereign Wealth Funds, Investment Strategy, Asset Allocation, Asset Management
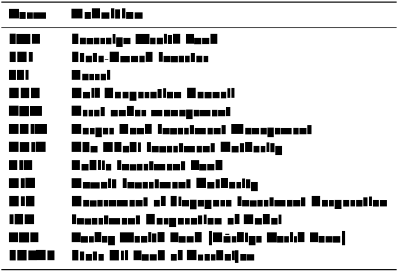
Abbreviations and definitions
Part 1. Introduction
Sovereign Wealth Funds (SWFs) have emerged as significant players in the modern global economy, attracting increasing attention and scrutiny due to their growing importance and influence. These state-owned investment funds, often fueled by commodity revenues, have amassed substantial assets under management, surpassing that of hedge funds and private equity funds combined as of 2023.
Figure 1: Total SWF AUM, $ billion
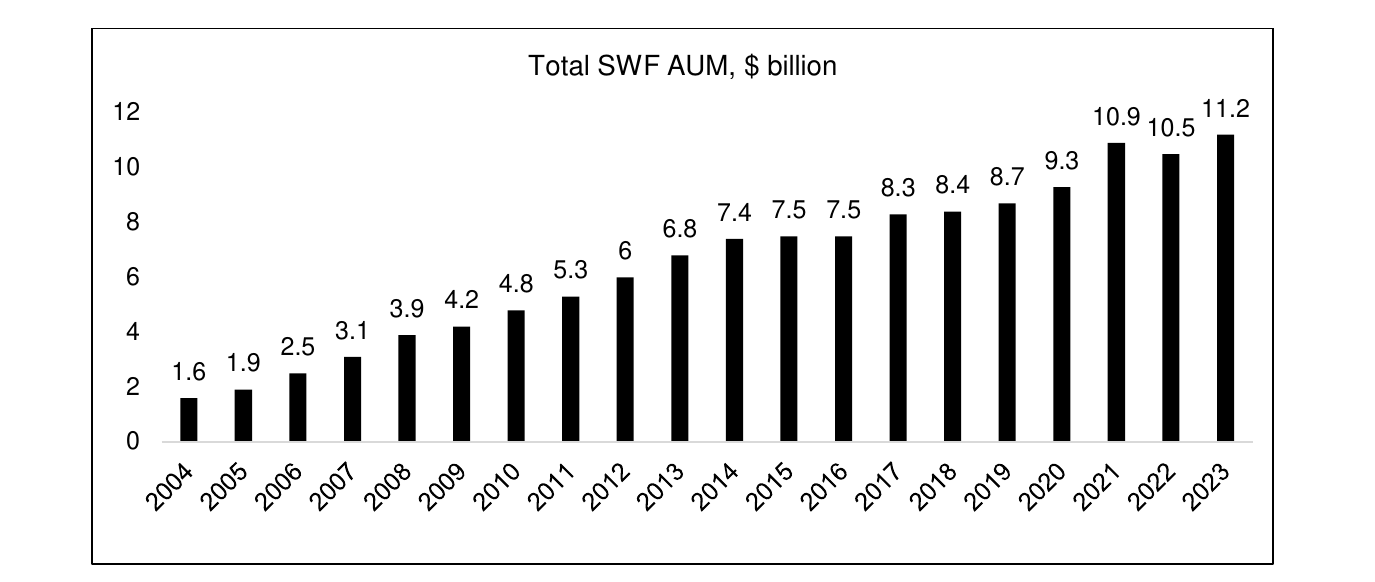
According to SWF Global (2024) there are 175 SWFs as of the end of 2023, managing a total of $11,164 billion. The assets under management of SWF are highly concentrated within top-10 funds, which account for 75% share of total AUM of all SWFs. SWFs are usually created by countries with high fiscal surplus that they are willing to reinvest and preserve wealth for future generations. However, setting up and managing a SWF is no easy task. As noted by Bernstein, Lerner, and Schoar (2013) many nations have struggled to preserve the wealth generated from natural resources, as exemplified by Norway in the 1970s and 1980s. Despite receiving a significant windfall from oil revenues, most of the funds were immediately spent. While some expenditures benefited infrastructure and social services, others, like high minimum wages and subsidies to declining industries, hindered long-term growth. Mismanagement of petroleum revenues led to financial chaos when oil prices plummeted in the mid-1980s (in 1985, the government's oil revenue in Norway decreased from approximately $11.2 billion, equivalent to around 20% of the country's gross domestic product, to $2.4 billion by 1988), resulting in public spending cutbacks, bank failures, and a wave of bankruptcies. This situation reflects a broader historical pattern seen in other nations facing sudden wealth influxes, such as the Netherlands' experience with ”Dutch Disease” in the 1960s and Spain's economic challenges from overseas conquests in 16th century.
SWF as a distinct type of investor
SWFs differ from traditional financial investors in several key aspects, including their objectives, governance structure and investment strategies. The table below outlines the main distinctive characteristics of SWFs.
Table 1: SWF characteristics
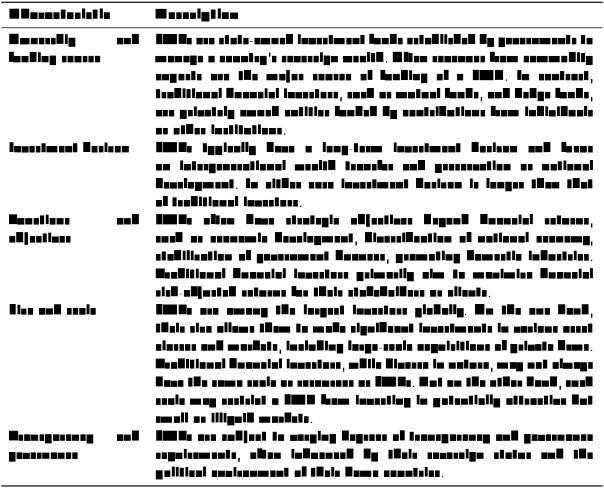
Thus, SWFs are very different from traditional investors. It would be hard and unproductive to make a detailed comparison of a SWF and a traditional investor for the following reason: there cannot be a unified basis for such comparison. The crucial difference between SWFs and traditional funds is that a SWF has only one shareholder (investor) – the government of its country. Every corporate entity aims to act in the interest of its investors. Therefore, it is impossible to judge on effectiveness of the fund not taking into account objectives of the government. In fact, a sovereign wealth fund is simultaneously an investment fund and a government agency. Assessing effectiveness of a SWF (or to be exact, of its investment policies) is a similar task to assessing effectiveness of a Central Bank or a ministry of finance. Another major difference of SWFs from traditional investor is cash inflow and outflow patterns. Most SWFs receive regular and predictable cash injections (usually from the sale of commodities), contrary to traditional funds, which have ununiform cash injections from new or existing investors. For example, Saudi Arabia's PIF holds a 16% in Saudi national oil company – Saudi Aramco – and thus receives regular dividends in the amount of approx. $19 billion a year, which it has to allocate. Secondly, some SWFs (especially saving ones) act as a source of government revenue. For example, Azerbaijan's SOFAZ's payments to state budget account for 45% of the total government revenue. Most traditional funds do not have such tight payment (withdrawal) schedules.
A brief history of SWFs
SWFs have a relatively modern history that can be traced back to the mid-20th century. The concept of SWFs emerged as countries sought to manage their growing foreign exchange reserves and commodity revenues in a strategic and long-term manner. As outlined by Naser (2016) SWFs went through several stages of development:
Table 2: Historic periods of SWF development
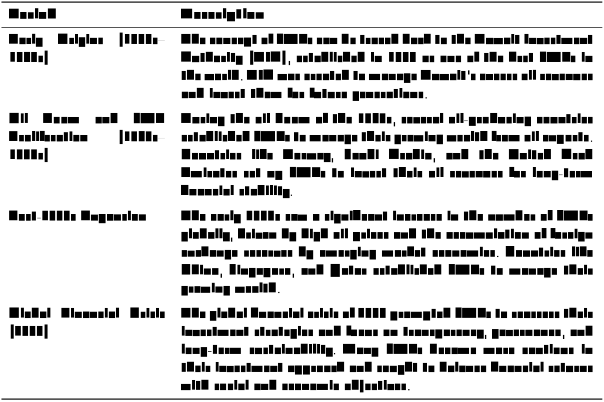
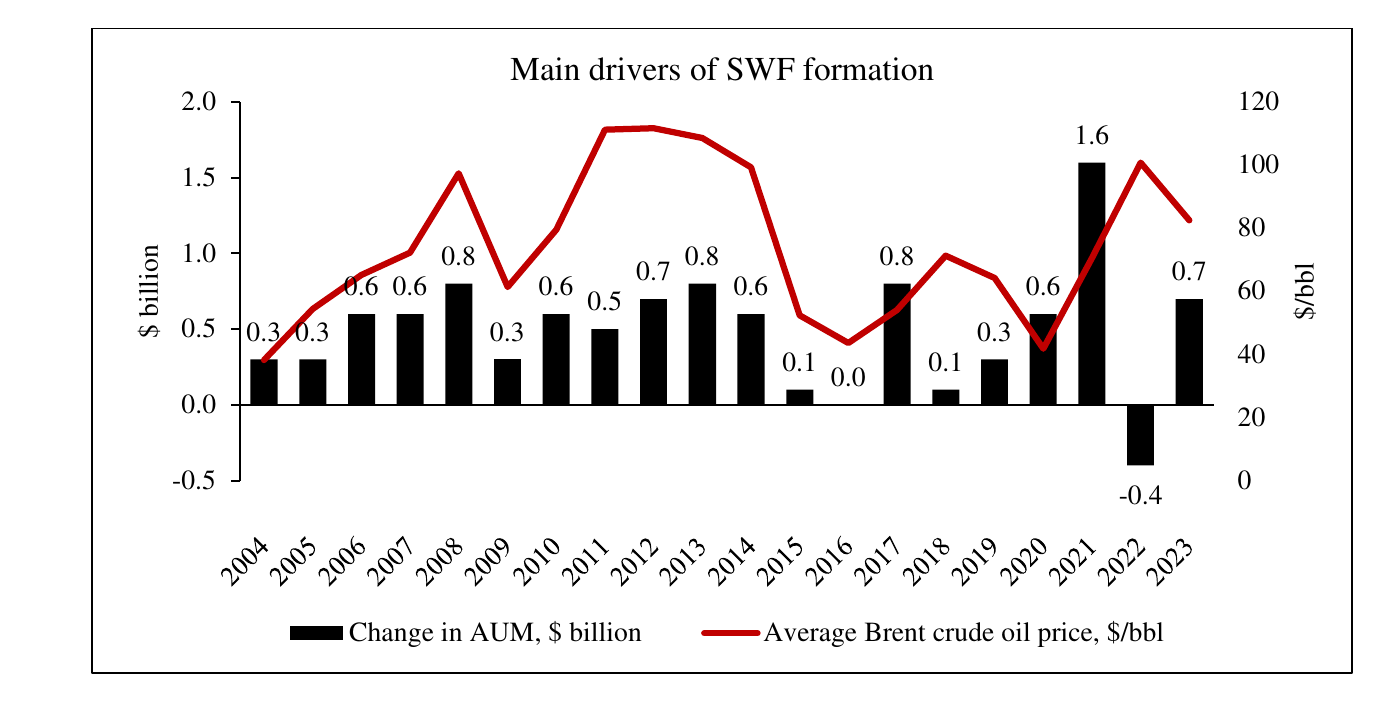
Braunstein (2018) outlines an important period in the formation of SWFs, aligning it with changes in institutional structures. Following independence from Britain, in the 1960s and 1970s, a number of Gulf economies established large SWFs with savings mandates, such as the Qatar Investment Authority, Abu Dhabi Investment Authority, and Kuwait Investment Authority, indicating concentrated state structures with significant autonomy from relatively disorganized domestic private finance sectors. Changes in domestic structures over time influenced the creation of SWFs with development mandates in the 2000s. In contrast, Kuwait opted against a large SWF with a development focus, instead operating a smaller strategic developmental subsidiary within the Kuwait Investment Authority. However, as noted by Megginson, You, and Han (2013), despite their growing size and influence it was not until 2007 when SWFs gained prominence as a result of the China Investment Corporation (CIC) acquired a $3 billion stake in Blackstone Group before its underperforming IPO. During the subprime mortgage crisis, Persian Gulfbased SWFs played a crucial role by investing $60 billion in American and European banks. From 2005 to 2008, SWFs collectively invested nearly $90 billion in U.S. and European financial institutions. Additionally, CIC injected $40 billion to recapitalize two state-owned banks. This substantial investment made SWFs the second-largest capital provider to global financial institutions during that period, following only the U.S. government. This explains in part, as we will see in the Literature Review section, that the majority of research papers on SWFs came out in this period. From the chart below it follows that the rapid growth of SWFs' AUM was to the large extent driven by the period of high oil prices in the 2000-2014 period. In fact, inflows to SWFs were strongly correlated with the oil price (Spot Brent Crude oil) during that period with correlation coefficient of 76%. However, in the 2014-2024 period this correlation diminished down to virtually zero. This change can be partly attributed to the growing prominence of non-commodity-based SWFs, such as Singapore's Government Investment Corporation (GIC) and Temasek, Turkey's Wealth Fund (TVF), and Australia's Future Fund. These funds derive their financing from the transfer of government assets, making them less susceptible to the volatility of commodity prices.
Figure 2: Main drivers of SWF formation in 2004-2023
Typology of State-Owned-Investors and SWFs in particular
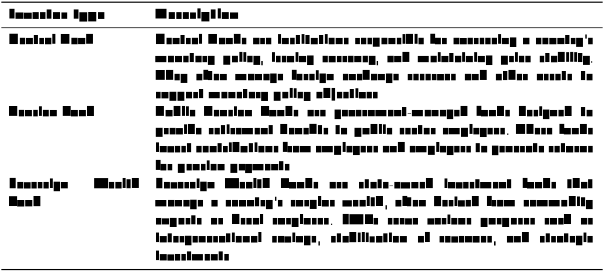
Before considering different types of SWFs, it is worth mentioning that SWFs themselves are part of a larger category of investors, which is State-Owned Investor (SOI). According to SWF Global (2024), there are three main groups of SOIs: Central Banks, Pensions Funds and Sovereign Wealth Funds.
Table 3: Types of SOIs
Yet, sometimes functions of SOIs interlap. SWFs are very diverse in nature and can assume some functions of pension funds and/or central banks (as we will see later). Likewise, some traditional functions of SWFs can be attributed to other government entities. For example, in Russia some functions of SWF are assumed by the Central Bank of Russia (managing foreign exchange reserves), Rosimuschestvo (managing government property), Ministry of Finance (financing developmental programs) and RDIF (attracting foreign investments). Now we can proceed to the typology of SWFs, as defined by SWF Global (2024).
Table 4: Types of SWFs
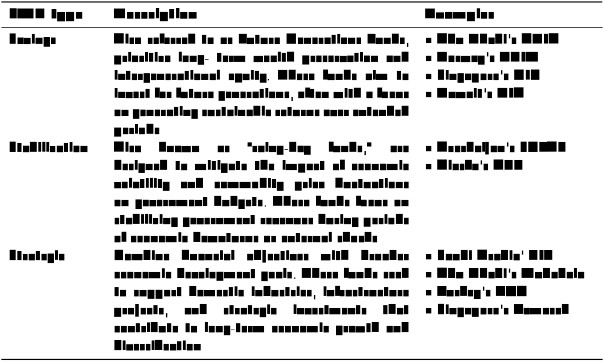
Often a nation creates separate SWFs for different purposes. The two most successful cases are Singapore (with Tamasek responsible for development and GIC for long-term wealth preservation) and Abu Dhabi (with Mubadala responsible for attracting technology to the emirate and ADIA for long-term wealth preservation). In a sense Savings Funds are very similar in nature to the pension funds. In the case of Norway its SWF (NBIM) is a management company for the Norway Pension Fund's assets. Thus, essentially SWF and PF are the one. In some countries, such as Saudi Arabia, a SWF also manages country's foreign exchange reserves, while Central Bank holds illiquid asset portfolio (a very uncommon combination), while in Azerbaijan its SOFAZ if also responsible for managing countries physical gold reserves.
Aim and novelty of the research
We can see that SWFs themselves are very diverse in nature and types. In this paper we pay special attention on the distinct characteristics of the different SWF types, contrary to the majority of researches on SWF that fail to make this distinction and consequently come to questionable conclusions. The most common one is inability to distinguish between so-called home bias (propensity of a SWF to overinvest in its home country, implying insufficient diversification) and intentional investment of a SWF in domestic industries as a part of its strategy. The primary objective of this research is to conduct a comprehensive comparison of how various types of sovereign wealth funds approach their asset allocation. Historically, academic literature has treated SWFs as a monolithic entity, an oversimplification that overlooks diversity in their objectives and, consequently, their investment strategies. This research seeks to highlight the heterogeneity among SWFs and examine how their differing goals influence their approach to managing investments. A secondary goal of this study is to compare SWFs of the same type, analyze the differences in their asset allocation and understand the causes of such differences. Additionally, based on this comparison we might be able to form recommendations for the funds, but one must be cautious here as optimality of asset allocation always interferes with optimality of economic policies.
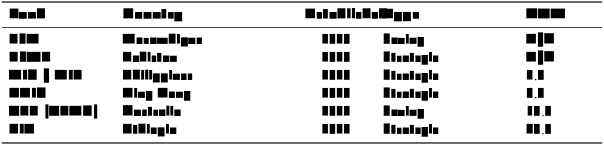
The third objective is to critically assess the alignment between existing theoretical frameworks on SWF investment strategies and the actual practices observed in the field. To achieve the first objective, this study will employ a quantitative methodology, albeit in a simplified form. For the second and third objectives, a case study approach will be adopted. Thus, we can formulate the following hypotheses regarding asset allocation of the different types of SWFs: H1: When accounting for the type of the fund, home bias will not be observed H2: Strategic funds will invest in private equity more heavily H3: Strategic funds will be more leveraged than saving or stabilizing funds H4: Stabilizing funds will have the highest level of liquidity H5: Saving funds will invest in public equities more heavily than stabilizing funds The rationale for such hypotheses is presented below. Saving SWFs are primarily focused on preserving wealth for future generations. These funds face minimal political pressure as they are usually not bounded by any sort of financial obligation to the government (at least in the medium-term). Investment strategies of such funds are therefore long-term and risk-averse aimed at ensuring intergenerational equity. Such funds can also afford to maintain lower liquidity levels. Saving SWFs are rather similar to pension funds in their investment strategies and are generally homogeneous between each other. Stabilizing SWFs, on the other hand, are designed to smooth fiscal volatility by compensating for fluctuations in national income. These funds operate under moderate political pressure, as they are only required to provide liquidity to the state budget in a timely manner and sometimes at a fixed schedule. Their investment horizon is shorter, focusing on low-risk assets to ensure availability of funds when needed, resulting in little variance in their investment portfolio. Strategic SWFs are established with the aim of developing the national economy, often through direct investments in strategic sectors. They face very high political pressure as their operations are closely aligned with national development goals, leading to diverse liquidity needs and a high level of financial risk. The investment horizon of such funds can vary widely. While their goal is to facilitate economic growth (a long-term task) sometimes they face pressure to show short-term results in certain projects (as we will see in the PIF analysis). Still, despite the variance between funds are limited within each category it is still rather significant. Some stabilizing funds, for example, also have parts of their portfolios allocated for development needs and some parts of strategic funds' portfolios are aimed to be a “rain day” buffer, that is taking a role of stabilizing funds. Most theoretical developments as well as empirical evidence is related to commodity-backed SWFs, that is those that are funded by revenues from commodity exports. Hence, in this study we also put more emphasis on this category of SWFs, although some findings and recommendations are applicable to a broader range of SWFs. This research might be helpful for already existing, growing and newly created SWFs as they can exploit useful theories (depending on their ultimate objective) and avoid mistakes and inefficiencies of other SWFs that are also covered in this study. The table below shows SWFs that were established after the year 2022.
Table 5: SWFs established after 2022
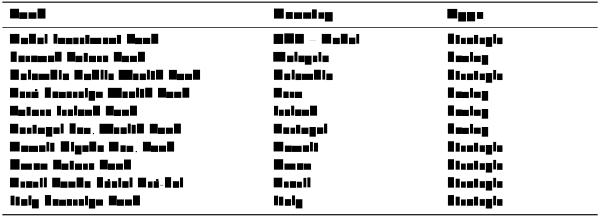
Additionally, there are several new SWFs that are currently being discussed at the governmental level and/or are already in the process of establishment as of the beginning of 2024. The table below provides a list of these funds.
Table 6: Proposed SWFs
The structure of this research paper is organized as follows: Initially, in Part 2, we delve into a comprehensive literature review that encompasses both the theoretical frameworks surrounding SWF investment strategies and the empirical studies examining their actual investment patterns. Part 3.0 offers an overview of the data utilized in this study, conducts a quantitative analysis to explore the relationships among the target variables of various types of SWFs, and briefly discusses the significance of the correlation between market portfolios and commodity prices. Part 3.1 is dedicated to a qualitative examination and comparison of two strategic SWFs, namely the Public Investment Fund of Saudi Arabia and Samruk Kazyna of Kazakhstan. Similarly, Part 3.2 analyzes two stabilizing funds, the Alaska Permanent Fund Corporation and the State Oil Fund of the Republic of Azerbaijan. Part 4 concludes the paper and suggests directions for future research on SWFs.
Part 2. Literature review
The research on SWFs is relatively young as it is not until the Global Financial Crisis of 2008, when most SWFs began to report on their activity and promote transparency. It is surprising though that most of the quality (that is relatively cited) research papers covering SWFs came out before 2015. Overall, we can distinguish several major branches of literature on SWF:
Research on investment strategies of SWFs, which aims to understand what factors affecting investment decisions of SWFs. Here one of the major questions is whether or not investments undertaken by SWFs are politically motivated. Other issues considered in this branch of research are:
What factors affect the acquired stake in target companies?
Do SWFs demonstrate herding behavior?
What factors affect strategic asset allocation of a SWF?
What strategic asset allocation is optimal for a SWF?
Effect of SWF's acquisition on target's performance and value. This is probably the major branch of research on SWF. It includes the following research questions among others:
What is the market reaction to SWF equity investments in listed companies?
What is the impact of SWF investments on the subsequent performance of targeted firms?
How does transparency in SWF operations influence market perceptions and reactions to their investments?
Political economy of SWFs. This area of research studies the intersection of political and economic factors that influence the establishment, operations, and investment decisions of SWFs. This field of study examines how government policies, political objectives, institutional frameworks, and international relations shape the behavior and impact of SWFs on global financial markets and domestic economies. The research questions corresponding to this branch of literature are:
How do political considerations influence the investment strategies and asset allocation decisions of SWFs?
In the following review we will primarily focus on investment strategies of SWFs and their approach to asset allocation, while also briefly discussing aspects of political economy, including the effects of domestic political landscape on structure of the SWF. Additionally, as it is crucial for analysis of strategic SWFs we will cover the literature on the role of SWFs in national development.
Investment strategies
As highlighted by Bazoobandi and Nugent (2017), Gintschel and Scherer (2008) and other authors for many oil-exporting countries, crude oil or gas reserves represent their most critical national asset. Changes in the value of these reserves directly impact the countries' wealth and citizens' well-being. The study highlights that without short sale constraints, the investment decision can be divided into determining efficient portfolios and a unique hedge portfolio based on oil sensitivities and asset covariance. Significant variation in oil sensitivities is found across assets at country and industry levels, indicating substantial hedge potential to reduce aggregate wealth volatility. When oil and financial assets each represent 50% of aggregate wealth, using industry stratification can nearly halve the variance of aggregate wealth. The paper demonstrates that considering the risk associated with nontradable assets like oil can significantly impact the risk profile of aggregate wealth and the efficient allocation of financial assets. Standard financial assets can serve as partial hedge instruments based on their sensitivity to oil price risk. The study reveals that hedge portfolio weights generally align with oil sensitivities. Countries like Belgium or Switzerland, with negative exposure to oil prices, receive positive weights in the hedge portfolio. Conversely, nations like the Netherlands or Norway, where natural resource companies constitute a significant portion of market capitalization, receive negative weights in the hedge portfolio. As to industries, the paper shows that in the optimal portfolio “energy producers receive negative weights in the hedge portfolio, while energy users, such as utilities, have positive weight”. Likewise, the optimal hedge portfolio has high weight for financial sector, as was widely confirmed in empirical studies. By analyzing coarse partitions across countries or industries in the global investment universe, the study reveals substantial variations in oil sensitivity, leading to reductions in aggregate wealth variance ranging from 20% to 50% compared to standard efficient portfolios. Naser (2016) also underscores the significant impact of oil price fluctuations on GCC SWFs, highlighting that among Middle East oil exporters (as of 2016), only the UAE, Qatar, and Kuwait are projected to maintain fiscal buffers for over 25 years, while Bahrain and Yemen are expected to deplete their buffers within the two years. Most other countries in the region may exhaust their buffers in 4-7 years, necessitating tighter fiscal policies and potential subsidy cuts to manage economic stabilization and equitable distribution of oil wealth. Thus, in order to avoid such scenario it is advised that commodity-backed SWFs deviate from market portfolio and hedge base commodity risk. These findings are supported by Irarrazabal, Ma and Parra-Alvarez (2020) as they delve into the correlation between the S&P500 index and WTI crude oil prices, revealing a time-varying relationship that cannot be perfectly hedged using standard trading strategies. As shown in the paper, prior to 2007, the average correlation was -7%, but it shifted significantly with the onset of the Great Recession, reaching a positive 30% by the end of 2018. Thus, oil-backed SWFs shall incorporate timevarying investment strategy aligning the hedge portfolio with changing oil price correlation, essentially using the delta hedging strategy to maintain oil-neutral position. However, the issue has never been analyzed in such framework. Our quantitative analysis also reveals significant variations in correlations between oil prices and market portfolio performance. Bodie and Briere (2014) suggests considering not only the risks associated with inflation and fluctuations in natural resource prices, which impact the variability of the fiscal surplus, but also to take into account all risks stemming from the fiscal surplus, as well as foreign and domestic liabilities. Furthermore, the variability of the fiscal surplus is influenced not just by commodity prices and inflation volatility but also by the sovereign's policies regarding natural resource extraction, taxation, and other related factors. Thus, the authors argue that s SWF must be analyzed in terms of overall country's financial position. This approach involves analysis of all the entities (including material balance sheet items, assets and liabilities, along with their associated risks) under state control such as the central bank, SWFs, pension funds, government agencies, and state-owned enterprises. By considering these entities collectively, their funds, even if held in separate entities, become interchangeable in times of crisis. To achieve this, it is crucial to evaluate not only the sovereign's financial wealth but also its human and natural capital. This, however, remained a conceptual framework and no further analysis has been proposed. Still, we may infer that it is rather hard to analyze SWFs as stand-alone entities without taking into account country's characteristics and fiscal position. Fotak et al. (2008) and Dyck and Morse (2011) both discuss the bias towards investments in the home country of the SWF, particularly in financial firms, indicating a preference for familiar grounds. Fotak et al. (2008) provides insights into the operational aspects of SWF investments, revealing that SWFs typically acquire a significant minority stake in target companies, whether publicly traded or unlisted. Moreover, a notable concentration of acquisitions occurs within the finance and banking sector, often facilitated through private negotiations. The paper finds that SWFs show a preference for investing in companies that have underperformed local market benchmarks in the preceding year. Dyck and Morse (2011) show that SWFs exhibit a significant tilt towards private equities, domestic investments, and specific industries compared to benchmarks. In the sample analyzed, SWFs own 2% of global public equities, representing only half of their portfolio mix by allocation percent. On average, SWFs allocate 52% to public equities, 29% to private equities, and 19% to real estate in their risky portfolio mix. Authors find a significant home bias, with SWFs owning 6.4% and 4.3% of public equity capitalizations in the Middle East and Asia, respectively. SWFs exhibit a distinct industry tilt, allocating 21% of their portfolios to the finance industry and owning nearly 5% of the public equity capitalization in finance. Apart from finance, SWFs also favor industries such as energy (15% allocation), transportation (9%), and telecommunications (7%). Authors argue that significant home bias and industry tilts observed in SWF portfolios are surprising as they go against what would be expected if SWFs were primarily focused on hedging domestic income risk. Again, such conclusions are based on the false assumption of homogeneity of SWFs. As will be shown later in this work, different types of SWFs have cardinally different approaches to investment, including propensity to invest at home and preference for different asset classes. As to preference for particular industries, Gintschel and Scherer (2008) have demonstrated that such behavior can be explained by the propensity of SWFs to invest in assets with negative or low correlation with oil prices. High share of SWFs holding in energy sector, on the other hand, might present a concern. However, as was mentioned before, that might represent share of the SWF in national resource exploiting company as in case of Saudi Arabia's PIF and national oil company Saudi Aramco. Similar models are exploited by Azerbaijan, Kazakhstan, Abu Dhabi and other nations.
Chhaochharia and Laeven (2008) and Megginson, You, and Han (2013) touch upon the diversification motives of SWFs, with the former highlighting biases towards countries with similar cultures and the latter supporting the pursuit of economic returns through cross-border investments. Chhaochharia and Laeven (2008) show that SWFs invest to diversify away from industries at home but show a bias towards countries with similar cultural origins, indicating that their investment decisions are not solely driven by profit-maximizing objectives. As a result, the long-term financial performance of SWF equity investments tends to be poor due to imperfect portfolio diversification. Such a conclusion is drawn based on comparison of SWFs' returns with a benchmark MSCI Global Equity index. Additionally, the authors argue that despite concerns about SWFs serving political objectives and investing in strategic industries, SWFs often invest in financially constrained firms, potentially enhancing their value by alleviating financing constraints. Similarly, Megginson, You, and Han (2013) reject the political influence hypothesis, demonstrating that SWFs primarily make cross-border investments for commercial purposes, akin to other investment entities. Furthermore, the research establishes a positive relationship between SWF investment and target country investor protection, economic development, and capital market depth. Thus, the authors generally agree on the importance of diversification, the influence of political factors on investment decisions, and the significance of considering correlations with oil wealth. Beck and Fidora (2008) discuss the optimal diversification perspectives for SWFs, highlighting the correlation of the financial sector with oil returns, again noting that the majority of SWF investments concentrated in the financial sector. Additionally, Beck and Fidora (2008) argue that if SWFs are driven by non-financial motives such as political considerations, there is a risk of excessive risk-taking and distorting asset prices. Concerns have been raised about the possibility of certain SWFs engaging in abrupt asset sales, leading to market volatility. Additionally, there are warnings that some SWFs might invest in sensitive industries, potentially bailing out or supporting local firms for reasons unrelated to economic factors. However, as of 2008, authors argue, there was no concrete evidence of such investment behaviors negatively impacting market integrity. Bernstein, Lerner, and Schoar (2013) similarly to Dyck and Morse (2011) delve into the political influences on SWF investments. To this day, Bernstein, Lerner, and Schoar (2013) remains the most comprehensive analysis of this topic and of SWFs investment strategies in general. Authors rightly note that SWFs are particularly interesting to study due to the potential interplay between their mission and ownership structure. While their investment charters typically prioritize maximizing financial returns for the benefit of long-term public policies like retiree benefits or economic development needs, the quasi-public nature of these funds exposes them to political influences, which may often prioritize more short-term goals. The authors highlight significant agency problems in structuring of SWFs due to political pressures that may lead to short-term support for local firms or industrial policies. There are contrasting views on the outcomes of these pressures: proponents of government-directed investments argue that underdeveloped financial markets may miss profitable opportunities, while the opposing view is that political involvement could result in misguided efforts to bolster inefficient firms or invest in trendy sectors, demonstrating a pro-cyclical behavior. This framework implies testable implications regarding the effectiveness of SWFs: if the optimistic perspective holds true, then SWFs primarily invest in local firms facing financial challenges that achieve strong performance afterwards. Conversely, if the pessimistic view is true, SWF investments will be skewed towards local firms, exhibit a pro-cyclical pattern, and result in poor performance. The analysis showed that SWFs exhibit a preference for investing domestically when local equity markets have high price-to-earnings levels, while showing reduced interest in domestic investments when foreign markets are highly valued. This behavior may stem from a strategic approach by sovereign funds to target markets with high option values and price-to-value ratios. However, an alternative interpretation suggests that they may be selecting overvalued investments. Subsequent return dynamics suggest that sovereign wealth funds are more likely engaged in ”trend chasing,” focusing on markets where equity values have already been inflated. However, there are disagreements among authors regarding the target preferences of SWFs. Kotter and Lel (2011) suggest that SWFs tend to target financially distressed, cash-constrained, large, and multinational firms with poor performance, particularly in financially developed countries. Moreover, authors find that SWFs exhibit characteristics of passive shareholders, as there is no significant long-term impact on target firms' performance and governance compared to a control sample. Overall, the study suggests that SWFs share similarities with institutional investors in their target preferences and influence on target firm performance, with transparency playing a key role in shaping SWFs' investment decisions and impact on target firm value. Transparent SWFs are observed to have a higher inclination towards investing in financially constrained and distressed firms compared to opaque SWFs.
Amar, Carpantieryand, and Lecourtz (2017) emphasize that GCC SWFs prioritize country characteristics over financial considerations in their investment decisions, suggesting motives beyond pure profit maximization. Majority stake acquisitions are depicted as a distinct decision that goes beyond traditional investment considerations, with financial aspects playing a minor role, if any. Additionally, the research indicates that transparent GCC SWFs are more inclined to acquire large stakes, particularly in countries within the European Union, nations with robust shareholder protection frameworks, and non-strategic sectors. These results collectively suggest that while the motivations behind GCC SWFs' majority acquisitions may extend beyond pure profit maximization, acquiring large stakes is not primarily a strategy for governments to secure strategic interests abroad. This partially supports Kotter and Lel's (2011) argument that increased transparency leads to improved investment diligence among SWFs. Below we present a summary of for-and-against papers with regard to several key questions mentioned in the above review.
Table 7: Main findings from the literature review
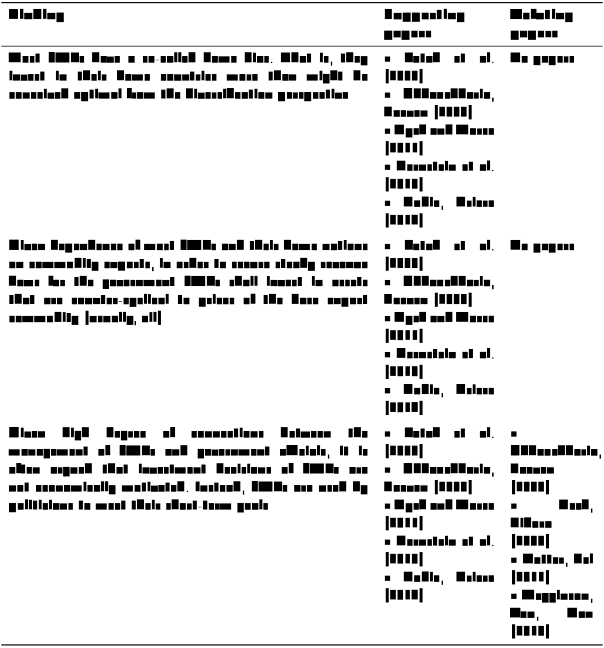
Thus, the question of whether the SWFs' investments are politically motivated remains unanswered. The ambiguity lies in the lack of a clear definition of ”politically motivated”. It is never explicitly defined and thus researchers are unable to analyze the phenomenon properly. As to the presence of home bias and the need for considering correlations with oil market all the reviewed studies give a positive answer.
Impact of domestic politics
Although, it was not proven that political factors impact investment decisions at deal level, they certainly influence SWF's structure, objectives and mandates. Research suggests that SWFs with greater political involvement tend to prioritize short-term economic policy goals over long-term wealth maximization (Bernstein, Lerner, and Schoar, 2013). Political factors can introduce additional risks that SWFs need to consider in their asset allocation processes. Geopolitical events, changes in government policies, or regulatory shifts can create political risks that impact investment performance and asset allocation decisions. SWFs may need to incorporate political risk management strategies into their asset allocation frameworks to mitigate these uncertainties (Bazoobandi and Nugent, 2017). Braunstein (2018) makes an important contribution by highlighting the significant impact of state-private sector relations on the creation, design, and utilization of SWFs in GCC economies, providing valuable case studies of several GCC SWFs. By analyzing differences in SWF structures and differences in underlying political landscape of respective countries, we are able to identify the institutional factors that impact SWF structure and hence, investment policies.
Kuwait. The absence of a large SWF with a development mandate in Kuwait's industrial domain, unlike its neighbors, is due to the historically strong presence of a well-organized domestic merchant, construction, and trade sector. This influential sector limits the development and utilization of SWFs for industrial activities in Kuwait. Additionally, the creation of Kuwait's
Investment Authority reflects the emergence of an SWF with a savings mandate in a setting with a politically weak private finance sector, similar to Abu Dhabi and Qatar. This trend supports the article's argument that SWFs with savings mandates typically arise in environments lacking a strong and politically organized private finance sector.
Abu Dhabi. The establishment of Abu Dhabi's Investment Company (ADIC),
International Petroleum Investment Corporation (IPIC), and Mubadala showcases instances of SWFs with development/diversification mandates in a setting with a politically weak private merchant, construction, and trade sector, similar to neighboring Qatar. This pattern supports the article's argument that SWFs with industrial mandates tend to emerge in environments lacking a strong and politically organized private sector. Between the 1970s and 2000s, Abu Dhabi created several state finance institutions with development mandates. The ADIC, established in 1977, operated under the ruling family's control and actively invested in international and domestic assets. The IPIC, created in 1984, focused on securing end markets for Abu Dhabi crude and expanded its investments across the hydrocarbon value chain internationally. Mubadala, founded in 2002, aimed to facilitate Abu Dhabi's diversification and transformation, engaging in various economic sectors.
Qatar. The centralization of decision-making structures in Qatar's industrial domain from the mid-1990s onwards, under the leadership of the Emir and a select group of policy-makers, led to increased state competition with the private sector, particularly in construction. Despite efforts by the Qatar
Chamber of Commerce to influence economic policy-making, the government's engagement through SWFs like the Qatar Investment Authority limited the Chamber's impact on policy decisions.
Bahrain. Bahrain's unique approach to SWFs differs from its neighbors due to the robust development of its domestic private financial sector. The absence of an SWF with a savings mandate in Bahrain aligns with the idea presented in the article that a strong and politically organized private finance sector can limit the establishment and utilization of SWFs with savings mandates.
The argument is also supported by case of Russia, where sovereign wealth fund does not play a significant role and only act as fiscal stabilizing instrument. According to Braunstein (2018) that might be due to highly developed financial sector in Russia so that private sector can obtain financing borrowing from the general public or through direct lending.
Role of SWF in national development
The paper by Gelb, Tordo and Halland (2014) discusses the appropriateness of using SWFs to finance long-term development needs, particularly focusing on whether these investments should be domestic or foreign. The paper emphasizes the importance of commercial or quasi-commercial domestic market investments by SWFs. It highlights that domestic investment by SWFs poses risks of destabilizing macroeconomic management and compromising the quality of public investments and the wealth objectives of the fund. Countries reliant on natural resources face critical policy decisions regarding their revenue utilization. These include determining the appropriate amount to save and invest for long-term fiscal and economic sustainability, as opposed to immediate consumption. There is also the consideration of whether to distribute part of the windfall to citizens (as in case of Alaska APF) rather than entirely allocating it through state spending. In addition to maintaining precautionary balances for shortterm stability amid volatile resource prices, there is a need to identify suitable longerterm investments. If a portion of fiscal expenditure is directed towards productive investments, it should be viewed as savings rather than consumption. This perspective expands fiscal capacity for domestic investment spending, provided that the investments effectively contribute to national wealth accumulation. High-quality public investment is crucial for economic growth, as poor investment management can lead to resource wastage and corruption. The risk of inefficiency increases when investments are rapidly scaled up without considering macroeconomic and institutional absorption constraints. The developmental role of some of the SWFs in part corresponds with the idea of return on purpose as it is defined in Milano et al. (2021). Return on Purpose refers to the concept of measuring the financial performance and value creation potential of a company based on its purpose-driven initiatives and strategies. It involves assessing how a company's purpose, beyond just profit-making, impacts its market value, profitability, operating margins, and overall financial success.
In the context of the article the authors analyze how companies with a strong sense of purpose tend to outperform those with a weaker sense of purpose in terms of market value, profitability, and returns on capital. They highlight that companies with a higher purpose score are likely to experience a positive impact on their market value, operating margins, and overall financial performance. The return on purpose can be quantified by assessing the financial benefits and value creation that result from investing in purpose-driven initiatives, such as building brand equity, enhancing consumer loyalty, and differentiating the company in the market. Companies that effectively align their purpose with their business strategies are more likely to achieve sustainable growth, higher market valuations, and stronger financial performance over time. The concept of return on purpose in relation to SWFs might involve measuring the financial and strategic benefits of investments that align with the country's objectives. By prioritizing projects that create long-term value, engaging in strategic asset allocation, and assessing the impact of investments on economic growth and strategic interests, SWFs can demonstrate their role in advancing the nation's development agenda. Though it is hard to quantify the degree to which a particular fund adheres to this principle, we will provide a qualitative assessment for strategic funds.
Summary of Literature Review
It is optimal for commodity-backed SWFs to deviate from market portfolio and hedge specifically commodity price risk by investing in sectors and countries with low or negative correlation with the corresponding commodity.
Additionally, time-varying strategy can be employed, adjusting the portfolio weights to the changing correlations thereby exploiting delta hedging strategy and maintaining commodity-neutral position.
As long as SWFs are part of wider economic policy making and are incorporated in the system of government finances it might be reasonable to analyze them, taking into account overall fiscal position of the country, including balance sheets of the central bank, pension funds and other SOIs.
Home bias, that is propensity to overinvest in their home countries, is widely present among SWFs, which might be the evidence for insufficient diversification.
SWFs have a particular interest in the financial sector. Not all authors agree that this is evidence of insufficient diversification.
There is no agreement between researchers on the ability of SWFs to make quality investments and outperform or at least keep track with the market.
Some authors show that SWFs make poor investment decisions and underperform market indices. Others argue that they demonstrate good stockpicking ability, providing capital for financially distressed but wellestablished firms.
Nonetheless, the general agreement among the analyzed studies is that transparent funds exhibit greater investment diligence compared to opaque funds.
Influence of political factors on investment decisions of SWFs is not confirmed. Some authors show that SWFs act rationally, others argues that non-financial characteristics are better explanatory factors for SWF investments.
Institutional factors have been shown to be a major factor determining structure, objectives and investment mandates of the SWFs. Countries with weak private financial sector create strategic SWFs as a way to foster economic growth as domestic financial sector is unable to assume this role.
Companies with a strong sense of purpose tend to outperform others, showing higher market value and profitability. This concept, when applied to SWFs
(especially strategic ones), involves measuring the long-term benefits of investments aligned with national objectives to advance development agendas.
Part 3. Data and Methodology
The primary source of data for this study is SWF Global (2024) (in particular, “Sovereign Wealth Funds Annual Report 2024” and “GSR Scoreboard 2023”), combined with funds' annual reports, investment policies, governmental decrees in relation to SWFs and other publicly available documents. The categorization of SWFs into types (saving, stabilizing, strategic) is in accordance with SWF Global (2024) data or is based on the fund's statements of its mission and functions in its report. Below is the list of 13 funds that we consider and analyze in this study. These funds combined account for 80% of total SWF AUM as of 2023. The final sample is chosen primarily based on data availability.
Table 8: Target sample of SWFs
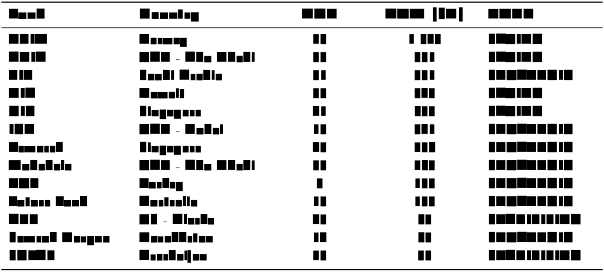
Table 9: Target variables on SWFs
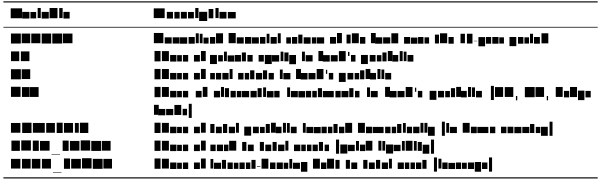
The data provided below outlines the investment strategies and their outcomes for two groups of SWFs: strategic and saving/stabilizing. We group saving and stabilizing together for two reasons: first, they are rather homogeneous between each other and second, given we only have two observations for stabilizing funds, the results would be non-robust if we divided the sample into three groups. By asset allocation in this paper we understand the structure of the investment portfolio by asset classes, geography, duration (in case of fixed income), sectors. Subject to the level of disclosure of different funds we must focus on the allocation by asset classes as it is the only one parameter that is reported by 100% of SWFs.
Table 10: Comparison between strategic and saving/stabilizing SWFs
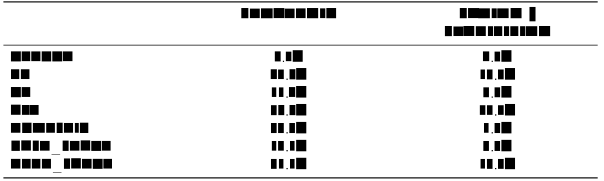
This information provides insights into how the types and objectives of SWFs influence their investment strategies and, consequently, their asset allocation and performance.
In the absence of such, the longest available period is used Strategic SWFs adopt a more aggressive investment approach compared to saving (stabilizing) SWFs. This is exemplified by their significant allocation to alternative asset classes, including private equity. In contrast, saving SWFs tend to follow a more conservative investment strategy, with lower allocations to higher-risk asset classes like alternative investments. The difference in the proportion of domestic investments between the two types of funds underscores the strategic SWFs' emphasis on domestic development and economic growth, while saving SWFs prioritize global diversification and risk mitigation. From this data it is already clear that the phenomenon of “home bias” is perfectly explained by the investment mandate of the fund (that is, its type). The allocation to real estate is somewhat similar between the two types of funds, albeit slightly higher in strategic SWFs. At first this seems illogical, as to why different types of SWFs with different purposes would hold virtually same stakes in such unconventional asset class. We may hypothesize that strategic SWFs focus more on developmental real estate projects for economic growth, while saving SWFs use real estate for hedging purposes due to its low correlation with the market portfolio. Thus, it would be useful to distinguish between different types of real estate as well, however given the available data it is not yet possible. Strategic SWFs demonstrate a higher tolerance for leverage compared to saving SWFs, indicating a more aggressive investment strategy and confidence in managing debt effectively for higher returns. However, there are exceptions, such as ADIA and KIA, which are saving funds but have relatively high leverage of 14.9% and 34.2% respectively. On the other hand, the Future Fund, a strategic SWF, maintains almost zero leverage (3.2%). Moreover, strategic SWFs maintain a higher cash to total assets ratio than saving SWFs, providing liquidity for seizing investment opportunities quickly or managing unforeseen liabilities. This liquidity strategy aligns with their development-oriented investment approach. It is important to note that stabilizing SWFs typically invest a significant portion of their cash in highly liquid securities like US Treasuries, ensuring they can provide necessary liquidity for the government when required. Now we will estimate the following equation to test significance of explanatory power of fund's type on its asset allocation, return, liquidity and leverage: 𝑦𝑖 = 𝛼 + 𝛽𝐷𝑖 + 𝜖𝑖 , where the 𝐷𝑖 is a dummy variable that takes value 1, when the fund is a strategic one, and 0 otherwise. Thereby, we assume that saving and stabilizing funds are more homogeneous than strategic ones, which is a reasonable assumption, given the above considerations. Of course, such a simple specification misses many important causal relationships between different characteristics of the fund. However, given a small sample size of only 13 observations, any more sophisticated specification will likely result in drop in significance, while the coefficients will likely be meaningless.
Table 11: Model estimation results
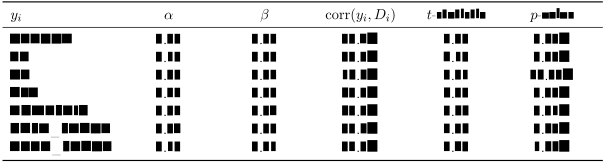
As can be seen from the table above, all the variables except for the share of real estate in portfolio are explained by the type of the fund at 5% significance level. Additionally, following the theory developed by Amar, Carpantieryand, and Lecourtz (2017) and Gintschel and Scherer (2008) we consider correlation between the market portfolio (as represented by S&P500 index) and the spot Brent oil price (the data provided by International Energy Agency). We estimate monthly correlations in daily price changes for the two time-series and then smooth them over a 36 month period. Thereby we are able to analyze trends in correlation between market index and oil price fluctuations. The graph below represents these correlations. We also plot 36-month smoothed spot price of Brent crude oil.
Figure 3: S&P500 and Spot Brent Crude oil price correlation, 2003-2024
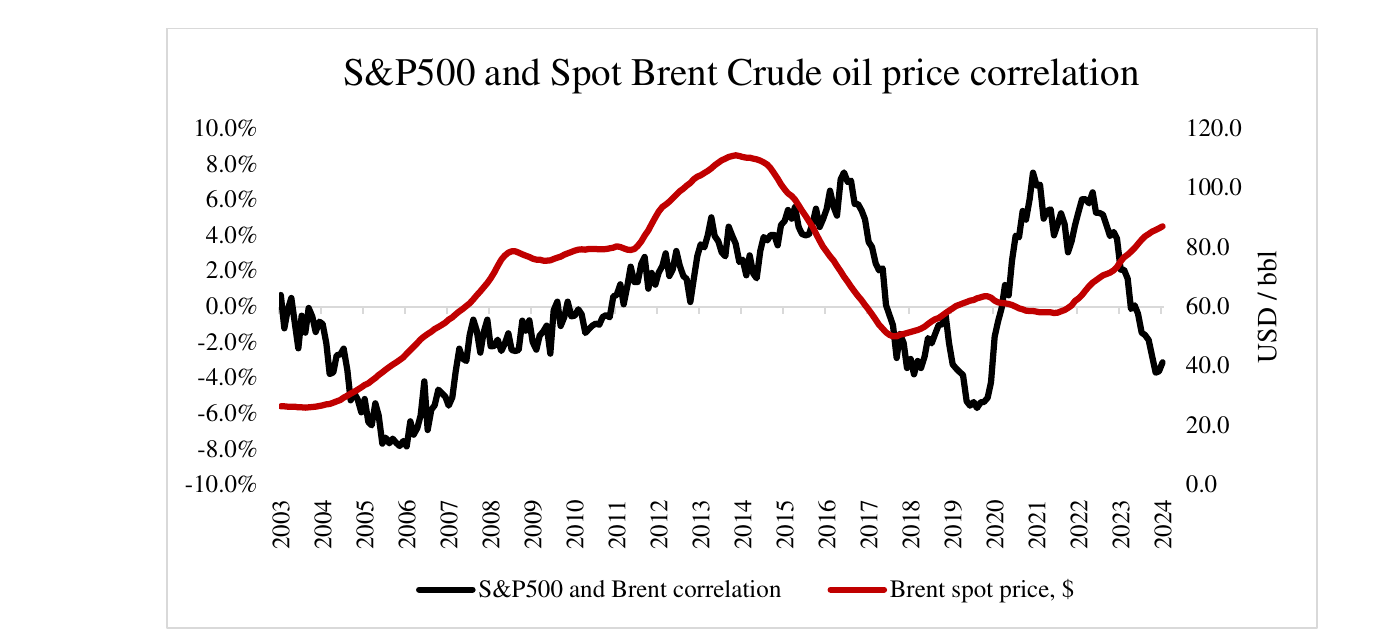
First, it is important to mention why such correlation can change. As long as market indices, including S&P500 and MSCI, are capitalization-weighted (that is companies with higher market capitalization receive) and therefore, increase in oil price, which leads to increase in capitalization of oil producing companies, leads in turn to increased weights of these companies in market portfolio. For example, S&P500 index is rebalanced quarterly. From the graph above one can see that increase or decrease in Spot Brent price generally precedes corresponding increase or decrease in correlation between market index and oil price. Econometric assessment of this phenomenon is not the aim if this study, so we will not go further into this analysis. However, it is important to highlight the potential dangers for SWFs that might occur as a result of this pattern. Indeed, the correlation between these variables has shown a consistent increase from 2006 to 2016, a decade-long trend. During this period, the weight of the energy sector within the portfolios of SWFs grew in tandem with rising oil prices. Now, with a downturn in oil prices, SWFs face a dual challenge: a reduction in revenue, typically derived from oil exports, and a depreciation in the value of their portfolios, which have become heavily invested in energy companies. Rather than serving as a buffer to counteract oil price volatility, the portfolio may instead display pro-cyclical tendencies. While this scenario has not been empirically validated to take place (for example during 2014-2017 period of falling oil prices), it raises a critical point of consideration for SWFs. Now we will proceed to the case study analysis and comparison of SWFs of different types, but in all cases – the commodity-backed ones. The reason is that almost all of the theory behind SWFs is based on the assumption that the nation has some fiscal surplus that it needs to allocate, thereby creating a SWF. However, this isn't always how SWFs are formed; for instance, Turkey's TVF was established through the organization of government assets, similar to Kazakhstan's SK, although the later also benefits from substantial oil and gas income. Singapore stands out as a unique case, having a considerable and consistent fiscal surplus without relying on natural resource exports. Thus, to make comparison more consistent and meaningful and also to align it with presented theories, our analysis will concentrate on those SWFs supported by commodity exports. We have selected Saudi Arabia's PIF and Kazakhstan's Samruk Kazyna for our case study analysis. These funds are both commodity-backed and strategic, with a satisfactory level of transparency. In analyzing stabilizing funds, we have opted for Azerbaijan's SOFAZ and Alaska's APF as the sole. However, we will not be comparing saving SWFs as only Norway's NBIM and Singapore's GIC provide sufficient disclosures, with GIC not being commodity-backed, rendering a significant portion of the theory inapplicable to it. Also, it is important to note that SWFs do not have a unified reporting framework (although there exist so-called Santigo Principles outlying best practices for a SWF, but it is the minority of SWFs that actually follow them and report on compliance) and therefore description of each SWF differs from one another. This is because we base our analysis on the information available in the reports and public government documents. In relation to financial information it is also important to mention that some funds (usually stabilizing or saving ones) report financial statements for overall portfolio of the parent company, while others (usually strategic funds) report consolidated financial statements of the group of companies. In this paper the following tools were used for searching, filtering and categorizing literature: Google Scholar, Scite AI and EconPapers. For grammar check and semantic enhancement we used QuillBot AI, Anyword and ChatGPT-4.
Part 3.1. Comparing strategic commodity-backed funds: PIF vs. Samruk Kazyna
Saudi Arabia and Kazakhstan exhibit distinct economic landscapes shaped by their natural resources sectors. Saudi Arabia's economy heavily relies on the oil industry, constituting about 50% of the GDP, 70% of export earnings, and 87% of budget revenues, despite ongoing diversification efforts through the Vision 2030 program. In contrast, Kazakhstan boasts a more diversified economy, with investments in various sectors alongside its reliance on resources like oil, natural gas, and minerals. Oil and gas sector in Kazakhstan accounts for only 17% of GDP and 40% of government revenue. Financial sectors in both countries are rather weak, thereby creating the need for a SWF as a development vehicle. Yet, for Saudi Arabia the ratio of banking assets to GDP was twice as high as in Kazakhstan: 66% vs. 27%, respectively.
Table 12: Comparison between PIF and Samruk Kazyna
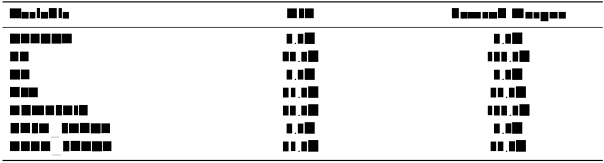
A fund profile: PIF
Established in 1971, the Public Investment Fund (PIF) was created to foster economic growth in Saudi Arabia. Upon ascending to the throne in 2015, King Salman designated the PIF to be under the oversight of his son, Crown Prince Mohammad bin Salman. Following this change, the PIF has embarked on a new strategic direction, significantly increasing its domestic and international engagement, notably through its involvement in Saudi's Vision 2030 and substantial investments in companies like Softbank and Uber. The Fund aspires to become the largest Sovereign Wealth Fund globally, aiming to manage assets worth USD 2 trillion (SWF Global, 2024). In what follows we based our analysis of the PIF on four key documents: the PIF Annual Report 2022, the PIF Law, Santiago Principles Self-Assessment Report 2023 and the PIF Investment Strategy 2021-2025. Additionally, the SWF Annual Report 2024 by SWF Global (2024) was used. PIF in its report states its objectives and mission:
Grow the assets of the Public Investment Fund
Unlock new sectors
Build strategic economic partnerships
Localize cutting-edge technology and knowledge
Thus, it is clear that the fund is of strategic type as its stated goal is to develop the local economy. Now, let us look at the financing sources for this development. PIF reports that it is financed by the following sources:
Retained earnings from investments
Capital injections from the government
Government assets transferred to PIF
Loans and debt instruments
The financial reporting part of the PIF annual report is very limited and exact proportions of each type of funding is unknown. Likewise, even the revenue structure of the fund is unknown and we are unable to assess the effectiveness of the fund's performance (at least the financial one). In the March of 2024, an 8% stake in Saudi Aramco (in additional to 8% that PIF already holds) was transferred from Saudi government to PIF, which brings around $9 billion of additional annual dividends for the PIF (Magid, Saba and Tanios, 2024). That is an example of transferring government assets as a way to finance the fund. Now with objective and financing in place, PIF targets the following sectors as its primary development goals:
Aerospace and Defense
Automotive
Transport and Logistics
Food and Agriculture
Healthcare
Entertainment
Financial Services
Telecom, Media and Technology
Real Estate
Utilities and Renewables
Building and Construction
Consumer Good
Metals and Mining
The fund is restricted from investing in Oil&Gas sector in an attempt to diversify economy. The goal of SaudiVision 2030 program is for the private sector to contribute 65% of GDP by 2030 (from baseline 45% in 2023). Although PIF does not provide a percentage breakdown of its portfolio by sector, it can be seen that the list is very diverse. Below the target observable variables are presented for PIF.
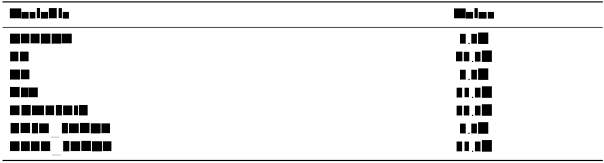
Table 13: PIF target observable variables
Portfolio structure
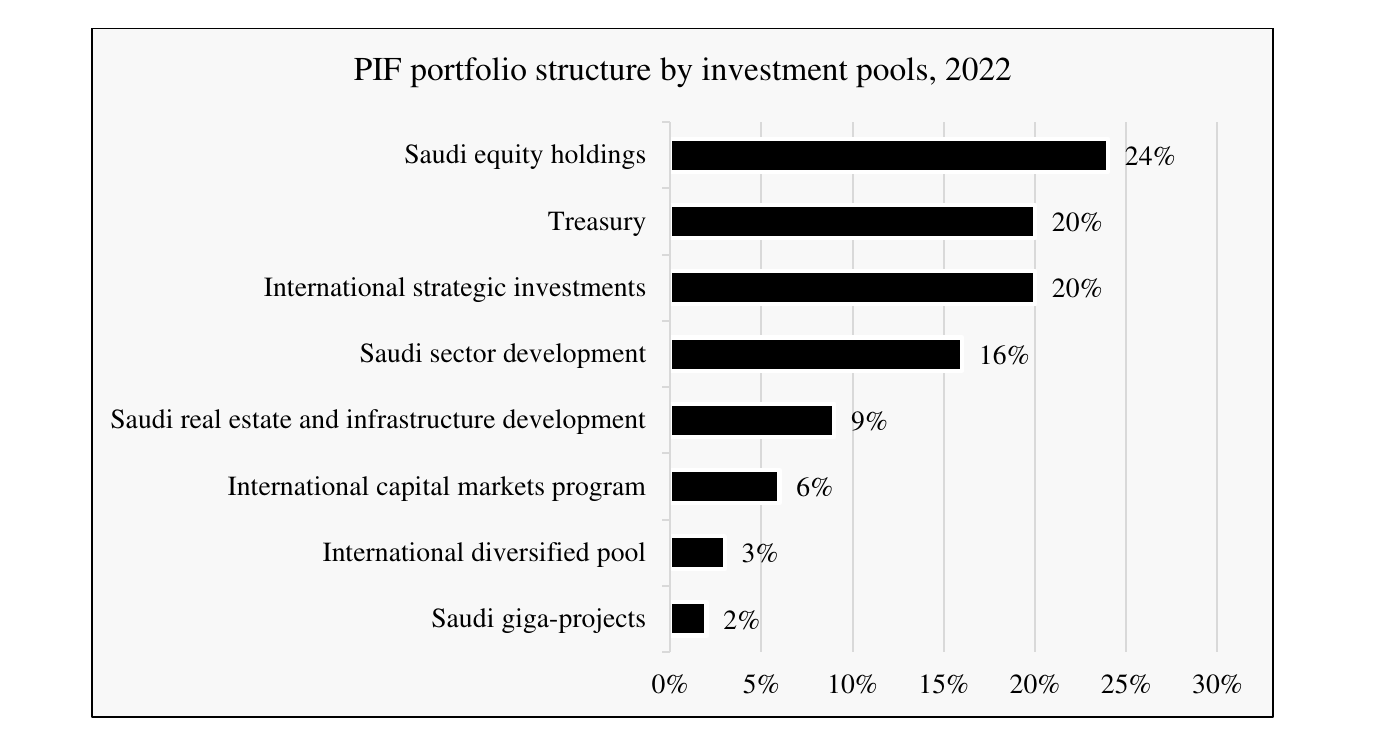
The PIF structures its investments in what it calls “investment pools”. For each pool a certain share of the total portfolio is allocated. The below chart represents the structure of PIF portfolio by pools.
Figure 4: PIF portfolio structure, 2022
The fund in its report presents a description for each pool and rationale behind it. In the table below these descriptions are presented.
Table 14: Description of PIF investment pools
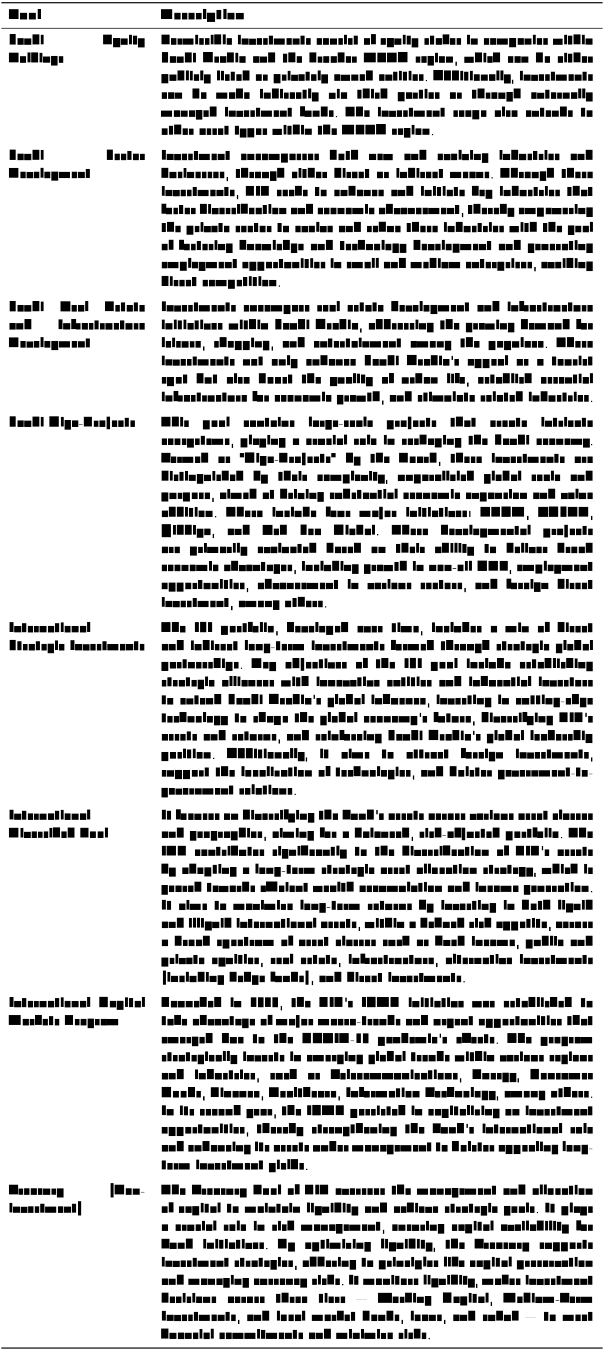
In all the reviewed documents the above descriptions of investment pools are final, no additional information is provided. These descriptions are vague, abstract, lack clarity and specificity. We may raise concerns about potential overlaps between the investment pools. For example, it is unclear, given the provided information, how the approaches and target investments are different for Saudi Equity Holdings pool and Saudi Sector Development pool. No information on the investment decisionmaking process or investment criteria is provided as well. In this grand scheme, the PIF is positioned as a cornerstone of economic transformation, however, the PIF's strategy to heavily invest in giga projects as a means to achieve these objectives raises some questions. This is exemplified by the case of Neom (Fattah and Martin, 2024). Originally envisioned to accommodate 1.5 million residents by 2030, the city known as The Line (Neom) is now expected to house fewer than 300,000 residents. The project, intended to span a 170-kilometer stretch of desert along the coast, is now projected to have only 2.4 kilometers completed by 2030. This adjustment has led to workforce reductions by contractors on the site. Initially set with a budget of $500 billion, the costs have escalated to $1.5 trillion by 2024. Throughout 2022, the PIF has poured over $7 billion into the initiative. Considering that over half of the funding was supposed to come from the PIF, even using $500 billion as a starting point, this amounts to $250 billion, or a third of the fund's assets under management. This raises questions about the investment's efficiency. The drastic cost increase within two years and the substantial downscaling of the project may partly justify the additional transfer of an 8% stake in Aramco to PIF.
Key features of the fund and recommendations
The analysis of the PIF reveals significant shortcomings in transparency, clarity of investment strategy, and risk management practices. The lack of transparency, vague investment policies, and potential overlapping of investment pools raise concerns about the fund's effectiveness in achieving its strategic objectives. The unacceptable failure in project appraisal, exemplified by the Neom project, underscores the consequences of non-transparent investment practices on the success of large-scale projects. The investment portfolio of the fund spans multiple sectors. It's also important to mention that the PIF has deliberately avoided investments in the oil and gas sector, demonstrating its dedication to promoting diversification. Based on these findings, it is imperative for PIF to enhance its transparency levels and improve the clarity of its investment strategy and policies. Recommendations for PIF include:
PIF should enhance transparency by providing detailed information on investment decisions, risk management practices, and performance evaluation criteria.
Formulate clear and specific investment policies to guide asset allocation and decision-making processes. That also includes implementing measures to prevent overlapping of investments across different pools to ensure efficient capital allocation.
Strengthen project appraisal processes to avoid failures like the Neom project by improving diligence in investment decisions.
By addressing these recommendations, PIF can improve its governance practices, enhance investment effectiveness, and mitigate risks associated with non-transparent investment practices.
A fund profile: Samruk Kazyna
Samruk-Kazyna is a national holding company owned by the government, which possesses shares in major Kazakh corporations across key industries such as oil and gas, transportation and logistics, the chemical and nuclear sectors, mining and metallurgy, energy, and property. The Fund serves as a tool for implementing industrial strategies and promoting diversification. It is currently undergoing a significant reform initiative aimed at privatizing several of its subsidiary companies (318 as of 2022) to draw in private investment. (SWF Global, 2024) Objective: To ensure sustainable economic development and long-term value creation through effective management of a diversified assets portfolio and business support in the interests of people of the Republic of Kazakhstan. Vision: A national economic leader, making a breakthrough in innovative development based on the principles of human welfare and environmental protection through responsible investments. The fund outlines its growth model in the report: Taking into account the current socio-economic situation of the country's development and the role of the Fund, it is advisable to focus investments primarily in the economy of Kazakhstan. In this regard, the management model of the Fund in the next 7 years is defined as a strategic holding with the tasks of maintaining social and infrastructural development of the country. By 2030, the Fund should move to the investment holding model under favorable market conditions with retention of majority share in the Fund's strategic assets. The Fund will strive to diversify its portfolio and fill it with breakthrough projects with a high share of exports to strengthen its competitiveness and reputation on a global scale.
The Government of Kazakhstan has approved two packages of investment projects under the Samruk Kazyna to address social and economic issues. The first package includes initiatives like gasification of heat power plants, water supply projects, and construction of new gas pipelines and railways. The second package covers projects such as modernizing the national electricity grid, renewable energy projects, and petrochemical projects, aimed at improving the quality of life for the population. In the reporting year, five investment projects worth KZT 1 trillion 344 billion were implemented. In terms of non-resource production development, Kazakhstan opened a petrochemical plant with a capacity of 500 thousand tonnes of polypropylene per year, aiming to diversify the economy and reduce reliance on raw material exports. The plant is expected to have a positive impact on the national economy by becoming a leading polypropylene producer globally. Additionally, plans for a polyethylene production plant are in progress to further enhance economic diversification. To address environmental issues, the conversion of Almaty CHP-2 to gas fuel is underway to reduce pollutant emissions. The project involves using gas turbine technologies and automation for emission monitoring, contributing to the transition to a low-carbon economy. Upon completion, the modernization is expected to reduce CO2 emissions significantly and meet stringent environmental standards. Infrastructure projects, such as the construction of gas infrastructure for heat and power plants in Almaty and a new wind farm in Shelek, are aimed at meeting growing energy demands sustainably. Water shortage issues in the western region are being addressed through major infrastructure projects to ensure reliable water supply for residential and industrial needs. The Astrakhan-Mangyshlak water pipeline plays a crucial role in providing centralized water supply to consumers in Atyrau and Mangystau regions, benefiting both the population and oil and gas enterprises. The Fund aims to enhance its commercial assets in the portfolio and transition to active portfolio management by 2024. This shift involves categorizing assets into strategic assets, where the Fund retains a controlling stake and actively participates in management decisions. During the economic recovery phase, investments will focus on priority sectors with co-investment principles. Foreign investments will be directed towards developed countries and industries for portfolio diversification. The Investment Policy aligns with the Fund's Development Strategy until 2032, emphasizing sustainable portfolio growth, financial well-being, and diversification by geography and asset classes. Investment decisions are guided by principles of commercial viability, compliance with local laws, and responsible investing, promoting sustainable development and excluding investments in certain sectors like tobacco and weapons. The Fund is an investor with a long-term perspective focused on generating enduring value and capable of enduring fluctuations in the short-term market. Investment standards include:
All investments must yield a positive net present value (NPV>0) and an internal rate of return exceeding the cost of equity (IRR > CoE)
Emphasis on having a strategic partner: new ventures are undertaken in collaboration with a strategic partner
International investments by the Fund are targeted at sectors strategically connected to Kazakhstan, excluding the oil sector. Investments are made across all project implementation stages and life cycle phases
The Fund utilizes various funding sources to execute investment strategies, including internal funds, dividends from portfolio entities, proceeds from divestments, borrowed funds from domestic and global markets, intra-group financing, and other available resources. Apart from Samruk Kazyna, another instrument for national development is National Development Bank of Kazakhstan. But the investment firepower is incomparable: while Samruk Kazyna manages KZT 33.5 trillion, NDBK only manages KZT 1.7 trillion.
Portfolio structure
Current portfolio includes:
Kazakhstan operator for exploration, transportation of hydrocarbons.
Kazakhstan operator for the import and export of uranium, rare metals, nuclear fuel for nuclear power plants
The largest operator of Kazakhstan's main railway network
Kazakhstan's largest diversified energy holding company, successfully integrated into the international energy balance
Kazakhstan's gas company operating along the entire chain from exploration and production to the sale of final products
System operator of the unified electric power system of Kazakhstan
Kazakhstan's largest telecommunications company, with the status of a national telecom operator
National postal operator of Kazakhstan providing a wide range of postal, financial, brokerage, and agency services
Kazakhstan's largest air carrier
Kazakhstan airline operating regional flights within the country
Kazakhstan company for exploration, development, extraction, processing, and sale of solid minerals
Kazakhstan company for the development and implementation of investment projects in the chemical industry
Energy production and transportation, including oil and gas
Transportation and logistics
Telecommunications
Samruk-Kazyna's investment portfolio reflects a strategic approach, with holdings across key sectors of Kazakhstan's economy. However, there may be concerns about overconcentration in certain sectors, such as energy and transportation. Overreliance on these sectors could expose the fund to sector-specific risks and economic fluctuations. Although the percentage share of each project in the portfolio is hard to estimate, the fund provides a break-down of its revenue by sectors.
Figure 5: Samruk Kazyna revenue structure by segments, 2022, KZT billion
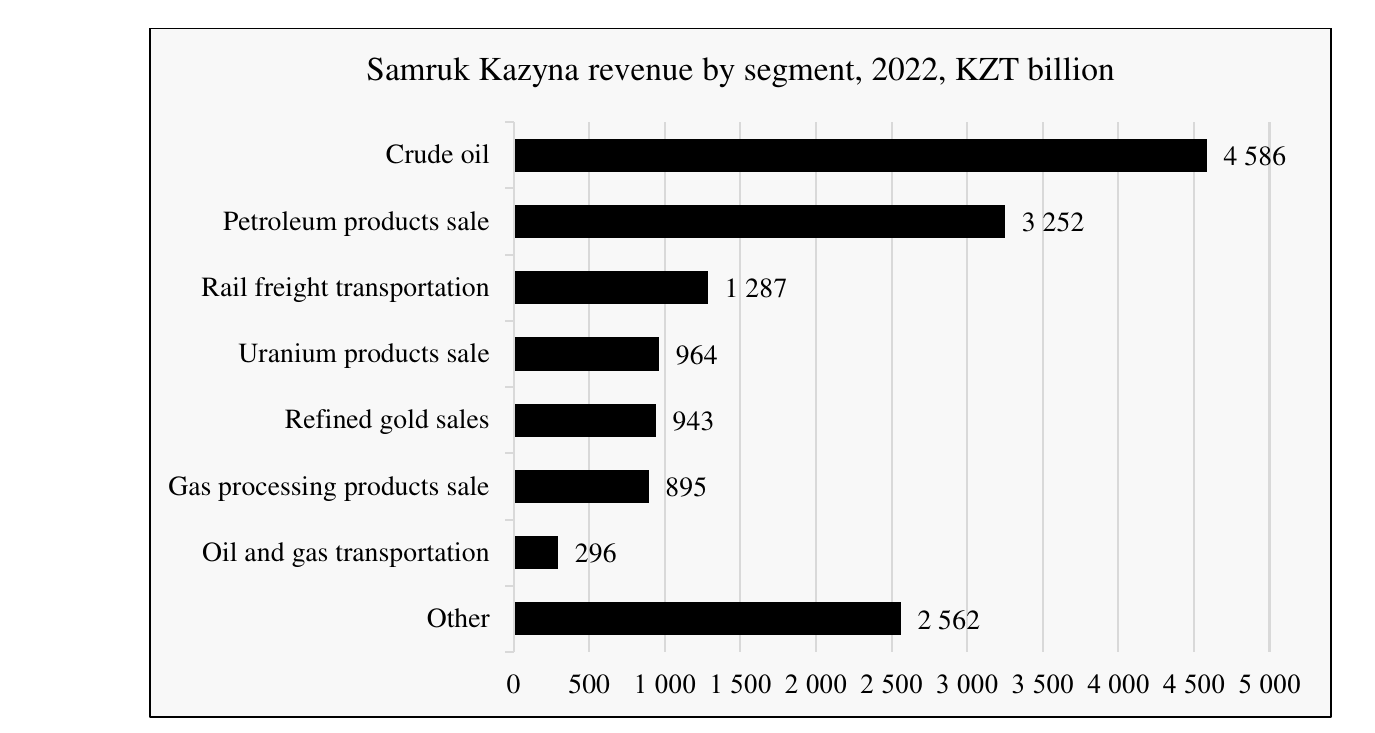
From here it is clear that still the vast amount fund's revenues comes from the natural resources exploitation and sales, with Oil and Gas related revenues accounting for 61% of total revenues. Gold and uranium make up additional 13%. Thus, the total share of natural resources in fund's revenues is 74%.
Key features of the fund and recommendations
The fund's organizational framework aligns with its stated goals. The fund demonstrates an acceptable level of transparency and outlines a clear short-term investment strategy for the upcoming years. However, an our analysis reveals a significant lack of diversification within the fund's portfolio across various dimensions, including asset classes, geographical regions, and industry sectors. Notably, the fund's investments are heavily concentrated in the natural resources sector, thereby amplifying Kazakhstan's economic reliance on this particular industry. The absence of plans to diversify away from the oil and gas sector underscores a potential vulnerability to market fluctuations within this sector. Furthermore, the fund's exclusive focus on Kazakhstan for investments exposes it to substantial risks associated with the national economy and the volatility of the oil market. Additionally, the fund faces liquidity challenges as its entire asset base consists of private equity holdings, which may pose difficulties in terms of liquidation. In summary, we can make the following recommendations for the fund:
While emphasizing investments in the Kazakh economy, diversifying the portfolio across different regions could help mitigate risks associated with the national economy, offering a buffer to support employment and production during economic downturns.
Given the susceptibility to revenue fluctuations in the oil markets, the fund should consider diversifying its investments into sectors such as consumer retail, manufacturing, construction, and notably, the financial sector. The absence of financial entities in the fund's current portfolio underscores the potential for diversification.
Exploring alternative asset classes like private equities and fixed income could enhance the fund's liquidity position, providing flexibility in asset management and potential avenues for capital deployment.
Discussing results
Although the two funds – Saudi Arabia's PIF and Kazakhstan's Samruk Kazyna – operate in relatively similar environments, their structures and investment strategies are drastically different. Below we outline the main differences between the fund, analyzsing across the following parameters: overall risk profile, liquidity, leverage, transparency. Risk The PIF assumes a higher level of financial risk by venturing into the establishment of new industries and sectors within the Saudi economy, often through greenfield projects like Neom. These large-scale initiatives are inherently challenging to evaluate accurately and frequently encounter cost overruns, as evidenced by Flyvbjerg (2007). In contrast, Samruk Kazyna adopts a more conservative investment strategy by focusing on existing enterprises and providing capital for expansion or modernization, thereby taking much less financial risk. However, the market risk for Samruk Kazyna is considerably elevated due to its concentrated portfolio in a single asset class, single country, and almost single sector of the economy, rendering it susceptible to country-specific and oil market risks. PIF, on the other hand, boasts a diversified portfolio spanning various industries, asset classes, and regions, mitigating some of these risks. Liquidity PIF demonstrates higher liquidity levels attributed to substantial holdings in the treasury pool. While Samruk Kazyna holds a slightly larger proportion of cash and equivalents relative to its assets, the predominance of illiquid private equity investments within the rest of its portfolio undermines its overall liquidity position. Leverage Both funds exhibit comparable leverage ratios, with PIF slightly edging ahead. This aligns with PIF's broader financial capacity compared to Samruk Kazyna. Moreover, the greater leverage level can be explained by more broad investment mandate of PIF and its objective to develop new sectors of the economy, contrary to Samruk Kazyna, which focuses on managing already created government assets and gradually developing and modernizing them – a more conservative approach. Transparency Samruk Kazyna excels in transparency, providing detailed information on portfolio companies, investment strategies, revenue structures, and detailed financial statements. In contrast, documents related to PIF are more conceptual and abstract, including the annual report, which offers financial data at a high-level and in an aggregated format, which makes it very hard to assess fund's effectiveness. As a class of strategic sovereign investors, both PIF and Samruk Kazyna demonstrate certain similarities. Notably, both entities prioritize investments within their respective home countries, predominantly utilizing private equity instruments to channel funds into local enterprises. Furthermore, neither fund actively uses credit financing to support national development projects. Also, expanding upon the case of PIF we can form recommendations that could benefit Samruk Kazyna, especially as it positions itself to play a more significant role in the Kazakhstani economy. It is advisable for Samruk Kazyna to place a strong emphasis on the rigorous project appraisal and be especially cautious with megaprojects, which can be very hard to manage and which economic value added is often uncertain.
Part 3.2. Comparing stabilizing commodity-backed funds: APF vs. SOFAZ
Before analyzing stabilizing funds, let us consider one example of a saving fund so that we can note the difference in asset allocation. Both saving and stabilizing funds tend to have zero or negligible investments in their home country. Often it is directly stated in the fund' investment policy. However, the crucial difference is the investment horizon and thus target liquidity level. NBIM is the largest SWF in the world, managing $1.4 trillion in assets. It'is goal is to preserve Norwegian oil wealth for future generations. Below one can see the portfolio structure of the NBIM by asset classes.
Figure 6: NBIM portfolio structure by asset class, 2022
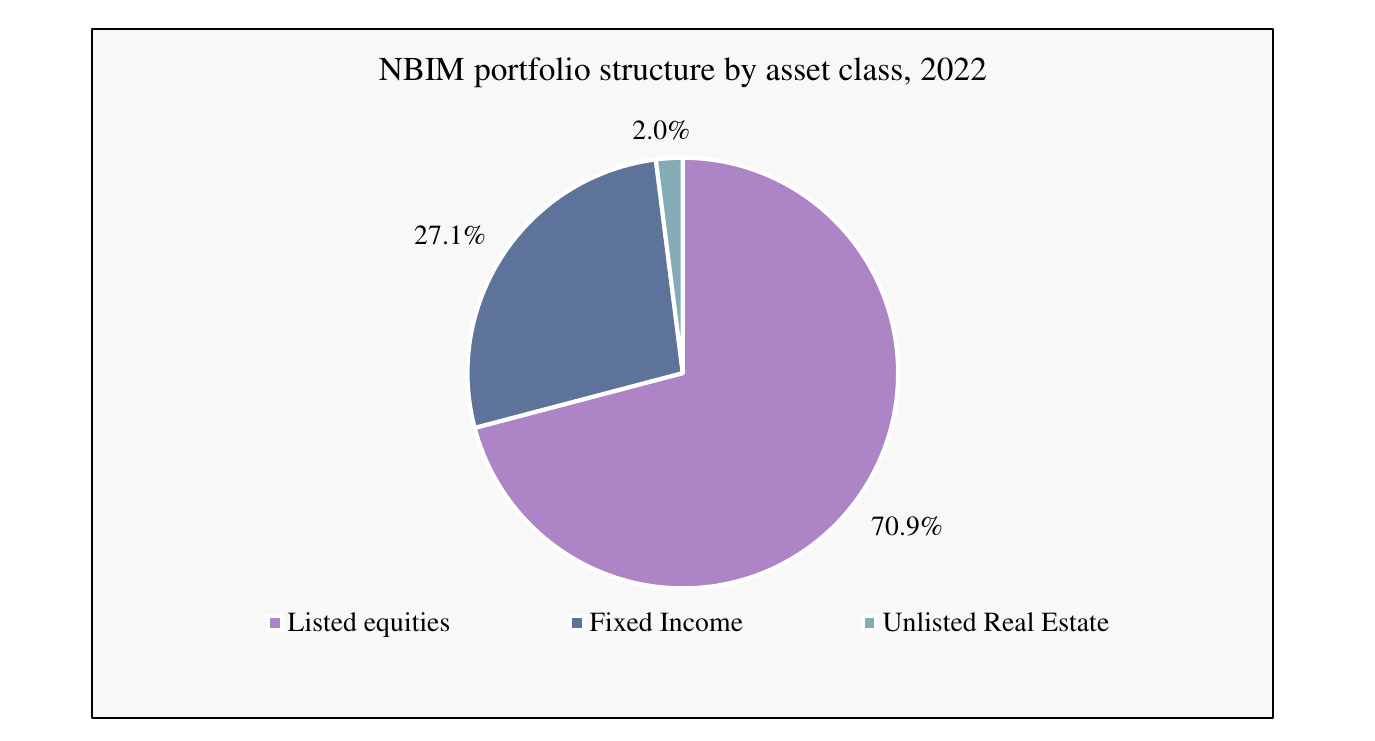
One can see that 70.9% of the fund assets are held in public equities. It is widely known (see, for example, Ibbotson and Chen (2002) among others) that in the longrun stock markets tend to grow and are insensitive to temporary shocks like changes in short-term interest rates (Campbell and Ammer, 1993) contrary to bonds. Thus, a high share of equities in the fund's portfolio reflects a more long-term outlook and also highlights absence of withdrawal needs. Azerbaijan and Alaska, while geographically distant, share similarities in their economic reliance on natural resources, particularly oil and gas. Azerbaijan's economy is heavily dependent on its energy sector, with oil and gas accounting for 47.8% of the country's GDP and over 92.5 % of export revenue (IMF Country Report, 2024). The country has worked on diversifying its economy, but the energy sector remains dominant. Similarly, Alaska's economy is largely driven by oil production, which contributes 85% of the state's revenues through taxes and royalties (Alaska.gov). Both regions face the challenge of fluctuating oil prices impacting their economic stability and fiscal position.
A fund profile: APF
The Alaska Permanent Fund Corporation (APFC) stands as the most prominent and well-known Sovereign Wealth Fund (SWF) in North America. Tasked with the investment and management of surplus funds from oil and gas profits, it is unique globally for providing an annual dividend to its residents, amounting to USD 1,606 per person for all 631,000 Alaskans in 2019. With a lean operational framework, managing USD 1.32 billion per staff member, APFC depends heavily on external managers both within Alaska and internationally to oversee the majority of its investment portfolio (SWF Global, 2024). In 2022 the fund's contribution to the state budget of Alaska amounted to $3.1 billion with the total state budget of $14.4 billion, which makes up 21.5% of budget revenue and 3.9% of the fund's total AUM.
Investment strategy
The Alaska Permanent Fund Corporation (APFC) organizes its investment programs by asset class and conducts an asset allocation study for the Fund at least once every five years. This study reviews asset classes, risk-return assumptions, and correlations of investment returns with benchmarks and across asset classes. The objective is to develop a diversified portfolio with long-term target positions for each asset class. The total Fund portfolio mix is designed to meet the Board's long-term target while aligning with the approved risk appetite. Each asset class allocation includes longterm target positions, maximum and minimum ranges, and zones (green, yellow, red) indicating expected variability, potential remediation, and required Board approval for remediation plans within specific timeframes.
Figure 7: APF portfolio structure by asset class, 2022
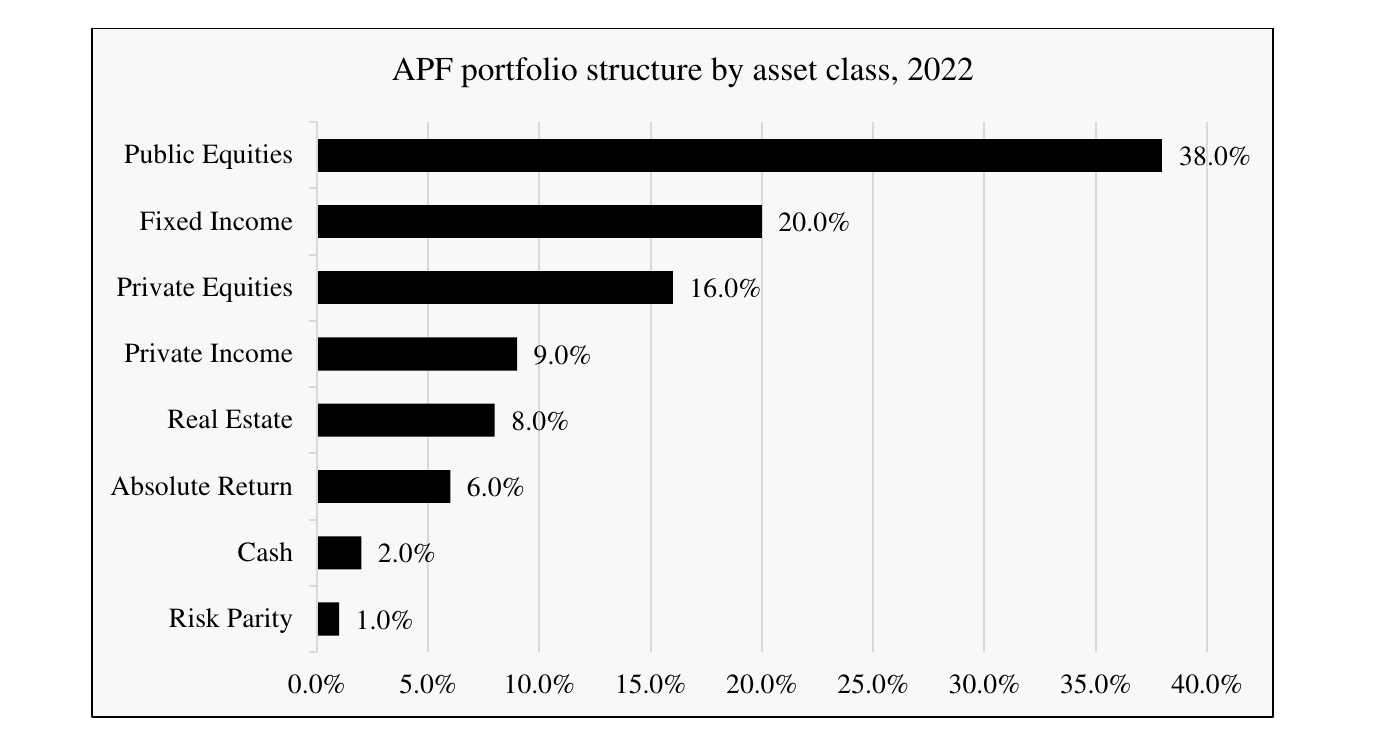
Equities form the largest allocation at 38%, indicating a significant emphasis on long-term stock market exposure. Fixed Income is the second-largest category at 20%, providing stable and predictable income. Private Equities represent 16% of the portfolio, offering high return potential. Real Estate, at 8%, adds diversification and a hedge against inflation. This structure reflects a balanced approach, leaning towards growth with a substantial allocation in equities, while maintaining risk management through fixed income and real assets. Public Equity The Public Equity portfolio aims to outperform the MSCI ACWI IMI Index while maintaining similar risk levels. The portfolio structure includes actively and passively managed equity strategies to enhance returns relative to the benchmark. External active and passive managers, as well as internal managers, will oversee the portfolio. External managers will focus on specific market segments, guided by investment manager agreements detailing strategies and objectives. Internal management may be approved by the CIO, with adherence to Investment Guidelines. The Director of Public Equity will lead the investment strategy, ensuring proxy voting aligns with maximizing the Fund's risk-adjusted return. The Director of Public Equity oversees risk management and compliance with the Investment Policy for the Public Equity portfolio. Specific asset class restrictions include risk limits outlined separately, prohibition of short selling without CIO and CRO authorization, adherence to derivatives usage guidelines, and compliance with external manager selection criteria for externally managed mandates. Fixed Income The Fixed Income portfolio aims to provide income-oriented returns and diversify risks from equity programs by investing in publicly traded and liquid incomeoriented assets. It seeks to meet or exceed the Fixed Income Composite Benchmark within predefined risk limits. The portfolio structure includes actively and passively managed strategies to enhance returns relative to the benchmark. The investment strategy is primarily managed internally by the CIO's APFC Staff, with external managers hired for specific segments based on their expertise and demonstrated ability to manage in line with benchmarks. Total Fund Cash The objective of the Total Fund Cash portfolio is to serve as a source of funds for the Fund's operational needs and allocate a low-risk, low-volatility asset class. Performance is evaluated quarterly against the 90 Day Treasury Bills Index, with long-term success measured annually over one, three, five, and ten-year periods. The portfolio is internally managed by the CIO to accommodate liquidity requirements, with investments in cash, US Treasuries, investment-grade corporate bonds, money market funds, and other approved cash equivalents. The CIO is responsible for managing risks and adhering to specific restrictions, including limits on maturity, allocation to gold-backed ETFs, prohibition of short selling, and compliance with derivatives guidelines. Private Equity The Private Equity portfolio aims to invest in illiquid growth-oriented assets to achieve superior risk-adjusted returns compared to the Public Equity portfolio. Investment strategies include venture capital, growth equity, leveraged buyouts, distressed for control, and other opportunistic strategies. Investments are made through capital commitments to funds, co-investments, and direct investments. The portfolio is diversified based on strategy, geography, industry, manager, investment size, leverage, vintage year, and market position. Specific restrictions include limits on venture capital (10% to 45%), growth equity (0% to 25%), buyouts/acquisition (25% to 75%), and specialized funds/investments (0% to 50%). Additionally, no more than 20% of the portfolio can be invested with a single Investment Manager/General Partner, and no more than 20% can be in publicly traded securities. The portfolio cannot acquire a controlling interest in an operating company without written approval.
The Real Estate portfolio aims to generate a risk-adjusted return with current income and capital appreciation while diversifying the Fund. Investments target core real estate globally, build-to-core properties, real estate funds, publicly traded funds, private funds, and co-investments. The Director of Real Estate is responsible for executing the investment strategy. Diversification considerations include investment type, property type, geography, manager, and leverage. Portfolio restrictions include limits on non-core real estate investments, property type weightings, investment manager concentration, and leverage levels. For example, leverage on core real estate is limited to 65% of the gross asset value, while non-core real estate leverage is also limited to 65%. Private Income The Private Credit and Income Opportunities portfolio aims to provide attractive risk-adjusted returns with a focus on generating income and potential capital appreciation while protecting the principal. Investments include higher yielding, illiquid opportunities covering various risk/return profiles in direct lending, distressed debt, and other credit-oriented strategies. The portfolio also includes income-generating investments like timberlands and structured credit. Absolute Return The objective of the Absolute Return portfolio is to achieve consistent returns uncorrelated with traditional asset classes. The goal is to generate returns similar to the total Fund with a correlation of less than fifty percent. The portfolio invests in limited liability funds, public or private securities, and financial instruments, with potential use of leverage. Investment strategies include relative value, event-driven, directional/tactical/opportunistic, and commodities. Risk management involves considering manager characteristics, strategy, size, leverage, correlation, and liquidity. Specific restrictions include allocation ranges for different manager types, liquidity requirements, and limits on exposure to individual managers. From this analysis we can see that a fund's portfolio is well diversified by investment pools and each investment pool is supported by the appropriate rationale. Now, as to geographical diversification, of the total fund's portfolio, less than 1% is invested in Alaska, thus demonstrating no home bias.
Figure 8: APF portfolio structure by geography, 2022
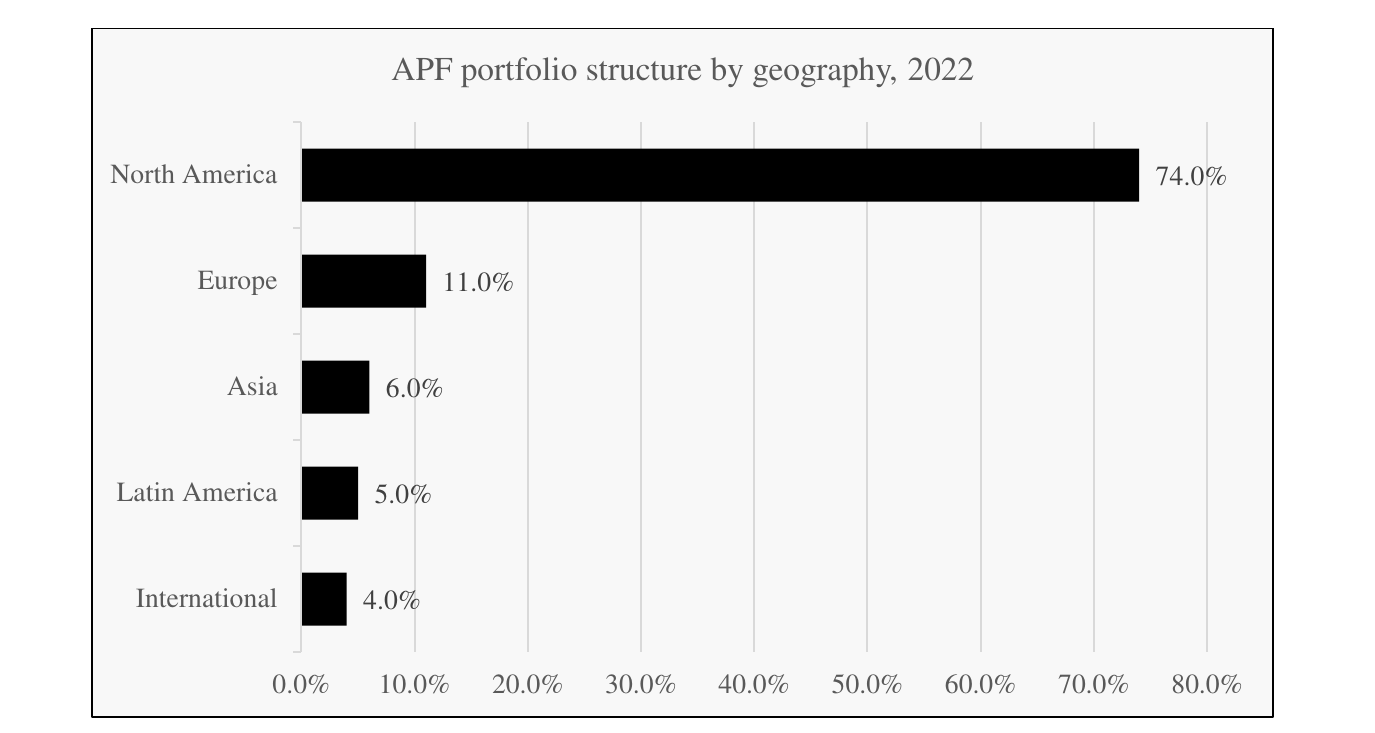
However, a staggering 74% of fund's portfolio is invested in North America, which clearly demonstrates significant country risks and potential for further diversification. As to sectoral break-down, the fund only reports structure of its private equity portfolio. We thus assume that it is representative of the overall fund's sectoral exposure.
Figure 9: APF PE portfolio structure by geography, 2022
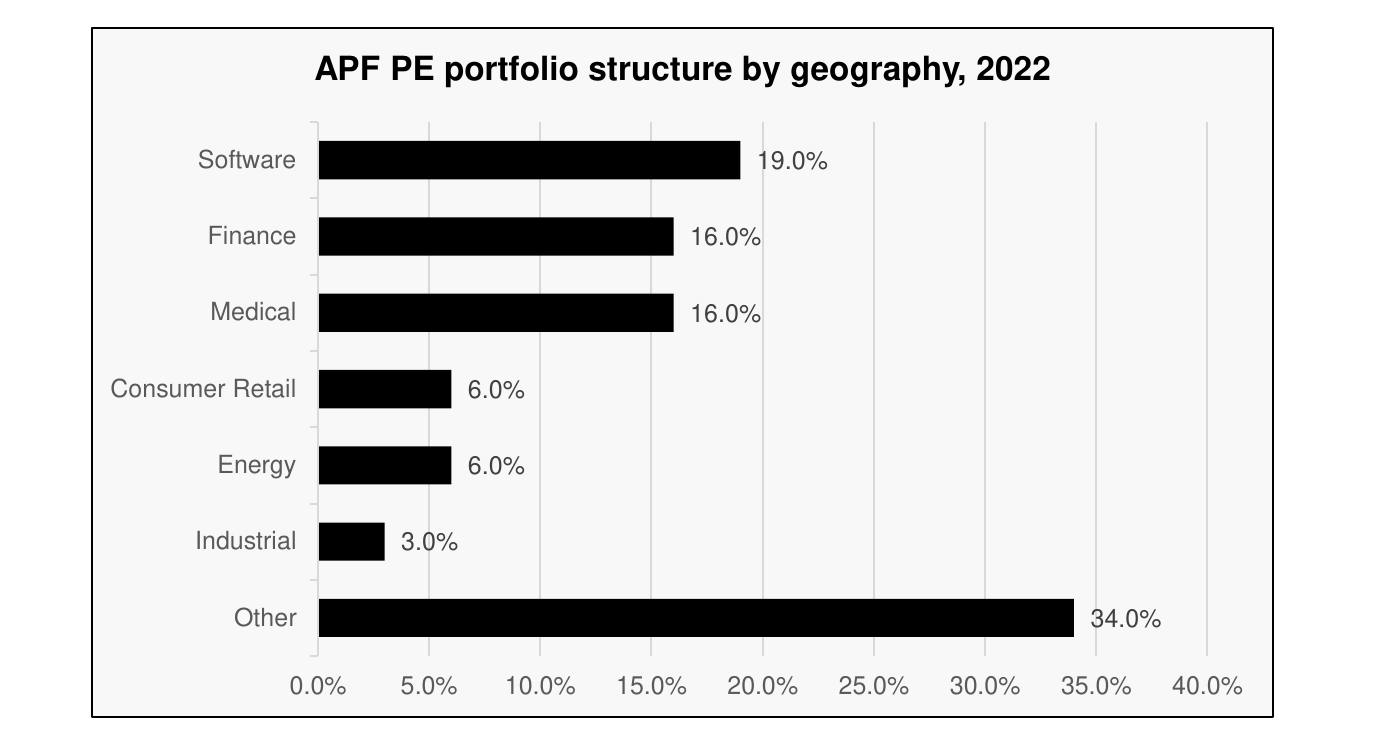
Again, as predicted by the theory, the fund invests in sectors with low or negative correlations with the oil market. In particular, the highest weights in the portfolio are given to software, finance and medical industries. Energy on the other hand receives only 6% - comparable with distribution of SOFAZ portfolio.
Key features of the fund and recommendations
The APF shows a consistent approach to its investment strategy, diversified across asset classes and industries but concentrated geographically. Overall portfolio is structured in strategic pools with set risk limits and economic rationale behind each one. On the basis of our analysis, the following recommendations can be formed:
Reassess the Benchmark Selection: It may be beneficial for the APF to review the suitability of using the MSCI ACWI IMI as a benchmark for its equity portfolio. As highlighted in the literature review, optimal strategies for oilbacked funds often involve deviating from the market portfolio and incorporating correlations with oil prices into equity weightings. Currently the index is tilt towards finance and technology companies, but the fund shall monitor this composition to maintain the oil-neutral position.
Evaluate Geographical Diversification: The APF should reassess the optimality of its geographical diversification strategy, particularly considering the excessive concentration of the portfolio in North America.
Regarding transparency of fund's reporting, the fund might want to consider adding duration exposure for its fixed income portfolio to the disclosures, although the final decision must take into account state interests.
A fund profile: SOFAZ
Headquartered in Baku, the State Oil Fund of the Republic of Azerbaijan (SOFAZ) operates as an autonomous fund distinct from the government and Central Bank. Initially established as a designated account within the national bank, SOFAZ transitioned into an independent legal entity. Its establishment coincided with the country's oil strategy implementation, focusing on the effective utilization of domestic oil resources and the responsible management of oil income to benefit the nation's populace. The annual budget expenditures of SOFAZ are allocated in accordance with the main directions approved by the Presidential decree and in compliance with SOFAZ's Statute. These expenditures are utilized to address the most important nation-wide problems and for the construction and reconstruction of crucial infrastructure facilities to promote socio-economic development in the country. The projects funded through budgetary expenditures and transfers to the State Budget aim to achieve macroeconomic and financial stability, reduce reliance on resource revenues, and foster sustainable growth of the non-oil sector. At the end of 2022, SOFAZ had accumulated reserves totaling USD 49 billion. This amount represents 85% of the country's strategic foreign exchange reserves and 62% of Gross Domestic Product (GDP). From 2001 to 2022, SOFAZ played a significant role in supporting the development of Azerbaijan's non-oil sector. During this period, SOFAZ transferred USD 118.2 billion to the state budget and allocated USD 11.8 billion to finance projects. Since 2010, excluding certain years, transfers from SOFAZ to the state budget have constituted approximately 40-50% of the state budget revenues. In 2022 the fund's contribution to the state budget of Azerbaijan amounted to AZN 7.9 billion with the total state budget of AZN 30.2 billion, which makes up 26.1% of budget revenue and 9.4% of the fund's total AUM.
Investment strategy
The fund employs several investment strategies for different asset classes to gain diversified exposure. The list of fund's strategies is provided below.
Table 15: Investment strategies of SOFAZ
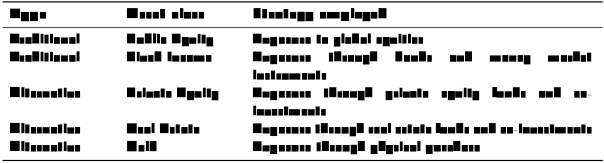
The fund reports on its investment criteria and decision making:
Interest rate risk. The duration of the debt obligations and money market instruments sub-portfolio should be within plus or minus six months around the average duration of the corresponding benchmark.
Credit risk. The maximum average weight of a single security or issuer in the investment portfolio should not exceed 15% of the total value. Assets resulting from investments for projects according to presidential acts are exempt from the limit on allocations to non-investment grade debt obligations and deposits.
Liquidity requirements. SOFAZ's assets should maintain sufficient liquidity to ensure timely execution of planned cash transfers, with a minimum liquidity level of USD 100 million in cash or cash equivalents. If liquidity falls below the minimum level, it must be restored within 7 business days.
Investment policy in relation to gold. The Fund is involved in the purchase of gold bullion for investment purposes with the intention of diversifying the investment portfolio with the ability to sell the gold in the future. Gold bullion is initially recognized and subsequently measured at fair value with gains or losses recognized in profit or loss.
As we can see, the SOFAZ maintains a robust and disciplined investment framework guided by stringent criteria and decision-making principles. Overall, the fund has a diversified portfolio structure by asset classes. Fixed Income securities form the backbone of the portfolio, comprising 62.1%, reflecting a conservative investment approach prioritizing stability and predictable returns. Listed equities represent 16.4%, offering long-term growth potential and diversification benefits. Lastly, Gold, making up 12.1% of the portfolio, serves as a hedge against inflation and currency devaluation as well as a mean to long-term capital preservation.
Figure 10: SOFAZ portfolio structure by asset class, 2022
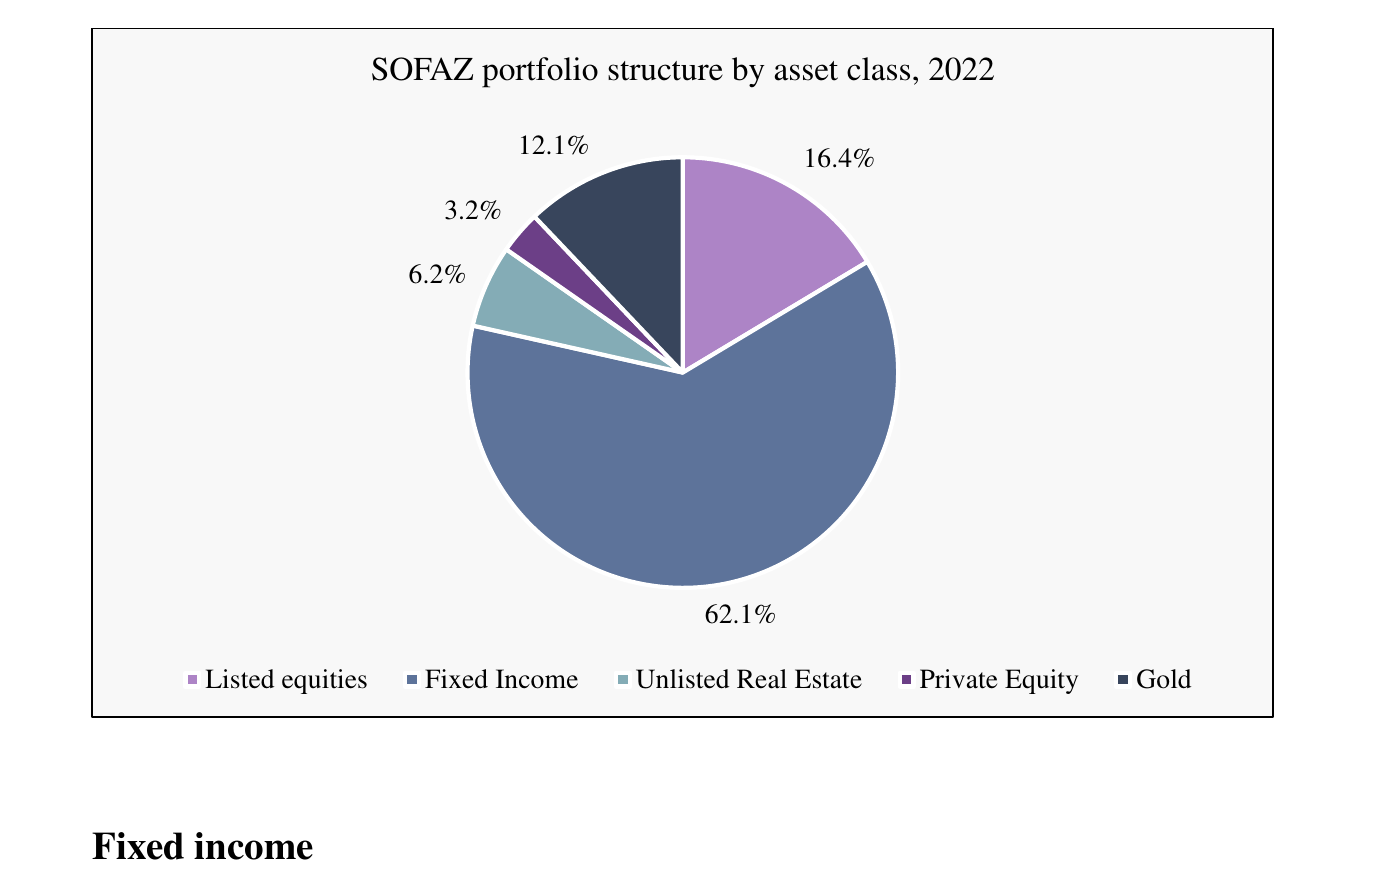
SOFAZ's fixed income investment strategy focuses on a diversified portfolio primarily consisting of bonds issued by governments, government agencies, international organizations, and corporates across various currencies such as USD, EUR, GBP, CNY, TRY, and AUD. The fund aligns its investments with benchmark indices for each currency portfolio to measure performance. The strategy aims to replicate the benchmark's composition while allowing for adjustments based on market conditions and economic outlook to maximize returns within an acceptable risk level. For instance, internally managed USD-denominated bond holdings returned negative 5.3%, outperforming the benchmark by 2.3% due to a shorter portfolio duration compared to the benchmark. Equity SOFAZ aims to maintain a diversified equity portfolio with a focus on investing predominantly in the MSCI World index. The MSCI World index offers extensive diversification across global markets and sectors. In 2022, the portfolio tracking the MSCI World index had a negative return of 15.5% in local terms (-17.6% in USD terms). Private Equity SOFAZ focuses on private equity investments by prioritizing buyout opportunities with top-ranking firms known for their consistent performance. The fund emphasizes ESG factors in decision-making to create a responsible investment portfolio. In 2022, SOFAZ committed to eleven funds and two co-investment opportunities, diversifying across sectors and geographies. The strategy targets attractive sectors like technology and healthcare, aiming for resilience across economic cycles and global reach. The portfolio is diversified across 23 fund managers, mostly operating in advanced economies with high-quality asset base. Real Estate Real estate portfolio plays an important role as a diversification tool and safeguard against inflation in the overall portfolio. Real estate portfolio is well-positioned to yield long-term steady cash flow and valued at USD 3.1 billion which constitutes 6.2% of the total SOFAZ's AUM and is expected to reach the target 10% in the upcoming years. In order to adapt to dynamic market shifts, along with traditional asset classes such as office, retail, residential, hospitality and logistics, current real estate portfolio encompasses tactical and market driven alternative classes such as life-science, data centers, senior housing, and student housing assets.
As to geographical allocation, the fund's portfolio is well-diversified by regions with North America accounting for only 33.4% of total portfolio.
Figure 11: SOFAZ portfolio structure by geography, 2022
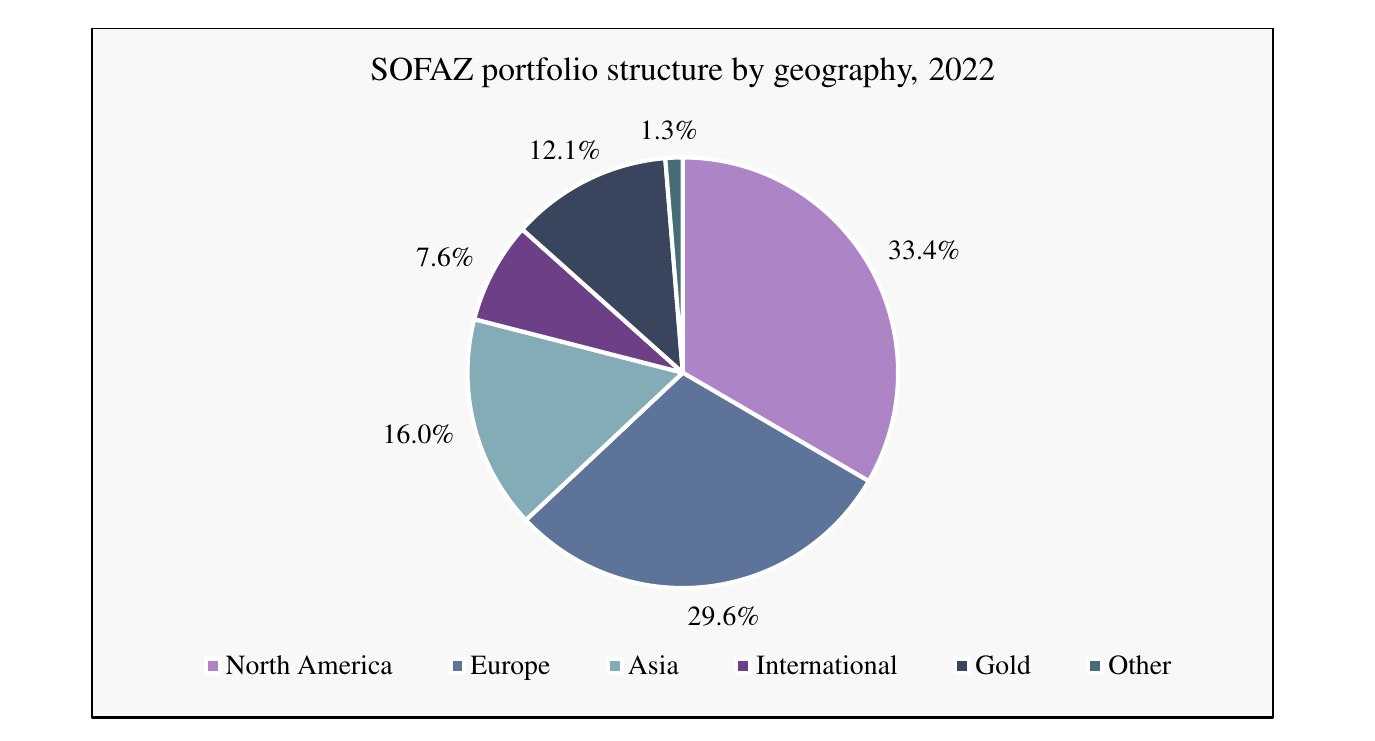
Break-down of SOFAZ portfolio by sector provides interesting insights and supports the theoretical predictions. Indeed, the two sectors with the highest share are information technology and financial services as they have low correlation with the oil market. Industrials even have negative correlation with oil prices, and they hold third position in the fund's portfolio. Energy, as predicted, only accounts for a small 3.8%.
Figure 12: SOFAZ equity portfolio structure by industry, 2022
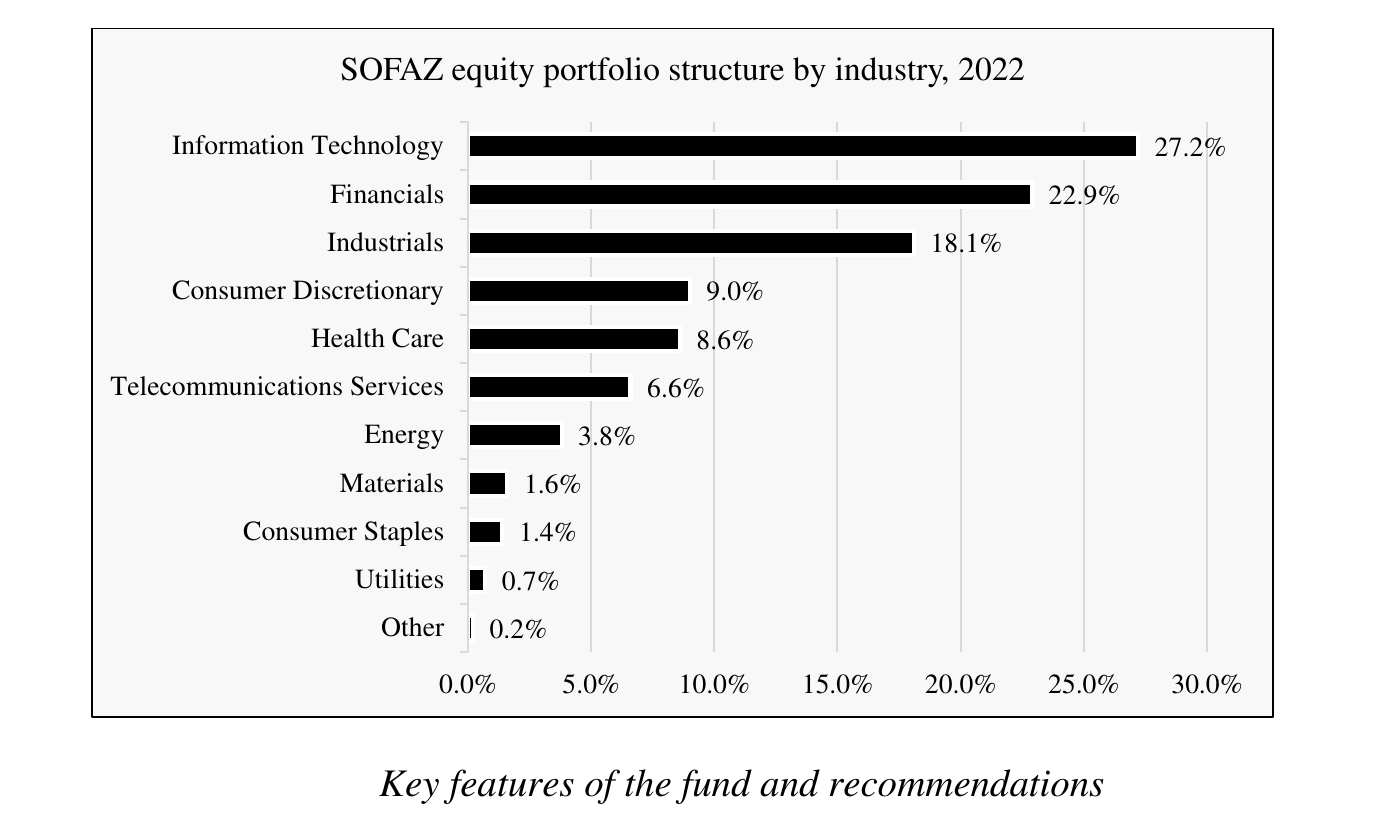
Key features of the fund and recommendations
The fund is well diversified across asset classes, industries and regions. Oil price risk is partially hedged by investments in IT, financial sector and industrials. Additionally, allocations to real estate and gold assets serve as effective hedges against inflation and recession risks. Fund is restricted from investing in home country, thus offsetting risks of domestic economic downturns. Among the recommendations to the fund we can name the following:
Reassessment of the rationale behind holding physical gold on the books could be beneficial. The fund might want to consider ETFs as a more liquid and cost-effective alternative for gaining exposure to gold.
A review of the optimal share of listed equities in the portfolio is advised.
Comparing the relatively small allocation to public equities with similar sovereign wealth funds like the APFC, there may be potential benefits in increasing the share of public equities to capture higher long-term returns. Yet, the management shall be cautious here as the fund cannot afford significant volatility of its income as it is still the primary source of state budget revenue.
Discussing results
Both funds are financed by revenues from oil and gas sales and share the common goal of preserving wealth in the medium term while providing contributions to their respective state budgets as needed. These contributions play a significant role in supporting the fiscal sustainability of their countries and hence affects the asset allocation of the funds. While the funds' contributions to the respective state budgets are comparable (21.5% for APFC and 26.1% for SOFAZ), the ratio of these contributions to funds' total AUM are very different: 3.9% for APFC and 9.4% for SOFAZ. Thus, the need for SOFAZ to maintain greater liquidity. In fact, these ratios somewhat correspond to the funds' share of portfolio allocated to fixed income: 20% for APFC and 62% for SOFAZ. SOFAZ demonstrates better geographical diversification across regions compared to APFC, which has a higher concentration of its portfolio in North America. In terms of portfolio allocation by asset classes, APFC shows greater exposure to public equities, indicating a potentially more aggressive investment approach. On the other hand, SOFAZ follows a more conservative strategy with a higher allocation to fixed income securities. Both funds exhibit a significant presence in the technology and finance sectors, with a lower allocation to the energy sector. This sectoral composition aligns with the theory's prediction of diversification to offset the negative impacts of fluctuations in oil prices. Regarding risk and liquidity management, both SOFAZ and APFC adopt a prudent approach by setting specified limits for each investment pool and risk type. Interestingly enough, the financial sector of Azerbaijan is relatively underdeveloped with banking assets to GDP ratio of only 44%. Yet, the country does not have its strategic sovereign fund but only a stabilizing one. In part, that can be explained by the deliberate economic policy: the fund transfers contribution to the state budget and the state itself acts as development institution, financing through subsidies and in other forms strategically important projects (primarily, infrastructure ones, of course).
Part 4. Conclusion
The aim of this research was to conduct a detailed comparison of how different types of sovereign wealth funds approach their asset allocation strategies. The study aimed to debunk the misconception of treating SWFs as a uniform entity by highlighting the diversity in their objectives and hence investment approaches. Additionally, in this study we compared SWFs of the same type, analyzing variations in their asset allocations, and understanding the underlying reasons for these differences. Furthermore, the study evaluated the alignment between existing theoretical frameworks on SWF investment strategies and the actual practices observed in the field. One of the key theoretical insights was that it is optimal for commodity-backed SWFs to deviate from market portfolio and hedge specifically commodity price risk by investing in sectors and countries with low or negative correlation with the corresponding commodity. Such behavior is observed in both SOFAZ and APFC funds. Another important theoretical insight is that structure and investment strategies of SWFs are heavily impacted by underlying political and economic landscapes of their countries. Especially, the two considerations are of particular importance: maturity of private financial sector in the country and the role of a SWF in stabilizing state budget. The inability of the private financial sector to effectively finance domestic projects will create the need for a state-sponsored investor with the role of developing the national economy. This assertion holds true in Saudi Arabia and Kazakhstan but is not confirmed by the case of Azerbaijan, where despite the relative immaturity of financial sector, a strategic SWF does not exist. The second assertion, however, was proved to hold true for stabilizing funds in Alaska and Azerbaijan. As the ration of budget contributions to total fund's AUM increases, it exhibits a more conservative investment strategy, allocation more assets to fixed income instruments. We observe that SWFs, especially the strategic ones, are highly purpose-driven and long-term focused. Their stated objectives go beyond pure risk-return maximization but creating value for the general public, which can be hard to measure precisely. Those include, for example, development of new sectors or creating jobs. Thus, although we are not able to measure return on purpose for such funds, it can be argued that they incorporate this principle in their investment decisions. Analysis of the PIF shows major issues in transparency, investment strategy clarity, and risk management, highlighted by the Neom project failure. Concerns include vague policies and potential investment pools overlaps. Despite diversifying away from oil and gas, improvements are crucial. Recommendations for PIF: enhance transparency with detailed investment information, formulate clear policies to guide asset allocation, and strengthen project appraisal to avoid past failures. Samruk Kazyna of Kazakhstan aligns investment strategy with its goals but lacks diversification, heavily investing in Kazakhstan's natural resources sector, risking economic reliance on it. It faces liquidity issues with all assets in private equity, exposing it to national economic risks and oil market volatility. Recommendations include diversifying across regions, sectors (like consumer retail, manufacturing, and finance), and asset classes to mitigate risks, support the economy during downturns, and improve liquidity. The APF's investment strategy is diversified yet geographically concentrated. Recommendations include reassessing the MSCI ACWI IMI as a benchmark, evaluating geographical diversification to address North American concentration, and potentially enhancing transparency by disclosing duration exposure for its fixed income portfolio. The SOFAZ fund is diversified across asset classes, industries, and regions, hedging oil price risk with IT, financials, and industrials, and inflation/recession risks with real estate and gold. It avoids home country investments to mitigate domestic downturn risks. Recommendations include reassessing physical gold holdings for ETFs and reviewing public equity allocations from the perspective of optimizing long-term risk-return profile (subject to state budget contributions).
Table 16: Hypothesis testing results
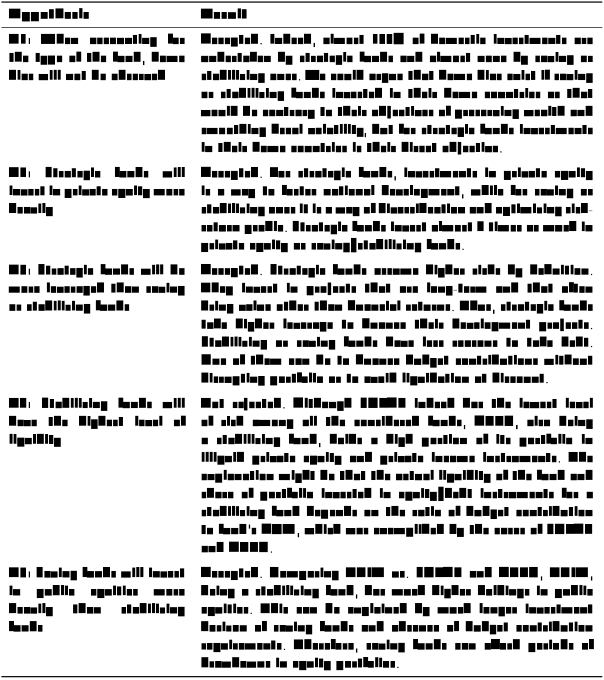
In conclusion, this research highlights the diverse approaches of sovereign wealth funds to asset allocation strategies based on their types, objectives and institutional factors. Key insights include the optimal deviation for commodity-backed SWFs and the impact of political and economic landscapes on SWF structures. The widely cited home bias was proven to be non-existent and is perfectly explained by the funds' types.
Further research
As noted in the Literature Review section, the study of SWFs is rather limited. A substantial gap exists that needs to be addressed. There are several critical areas that could significantly benefit practitioners in the field.
Optimal investment strategies of SWFs with regard to changing correlations between base commodity prices and subject to fund's exposure to other asset classes, obligations to the government, leverage, type etc. We hypothesize that the optimal strategy shall be dynamic, adjusting asset allocation to the current
(or forecasted) correlations. Moreover, such dynamic allocation strategy shall take into account schedule of considerations (transfers) to the government and the degree to which this SWF depends on commodity revenues.
Deal-level analysis of SWFs' investment strategies subject to their types.
Expanding upon analysis of Bernstein, Lerner, and Schoar (2013) and other authors, it would be beneficial, as we have shown, to incorporate type of the fund as explainable variable and redo the econometric analysis at the level of individual deals. Large datasets will allow to exploit more complex models than the one used in this study.
Conflict of interest of strategic SWFs and other government agencies. Given their significant financial resources and the often opaque nature of their investment decisions, it's inevitable that strategic SWFs will at times find themselves at odds with other government authorities. This can lead to a range of agency conflicts. For instance, a SWF may allocate resources to a project overseen by another government entity to help it achieve its yearly performance targets. There are can be many other instances where SWF's funds are used to fill short term liquidity gaps of various kinds, thereby undermining longer-term development goals of SWF itself. The ways to mitigate such agency problems can be explored.
Effectiveness of strategic SWFs in fostering economic growth and economic diversification. Again, it is no easy task to evaluate performance of a strategic
SWF given often very vaguely formulated objectives. Even though we can analyze trends in (say) economic diversification, it is unclear how to differentiate whether such diversification can be attributed to the efforts of a SWF or it occurred due to other factors. An in-depth analysis of this issue shall be of crucial importance for many strategic SWFs and their governments.
Effectiveness of strategic SWFs investments from financial standpoint. This is different from the previous point as now we want to consider not how well
SWFs promote economic development but rather how well they act as investors. Especially a detailed study of projects like Neom, including the exact pitfalls in the appraisal process, can be very helpful to avoid such mistakes in the future. Many SWFs and similar institutions around the globe have tendencies to over-rely on megaprojects, for example, so, they might find this analysis useful.
Optimal leverage for SWFs subject to their types. In this paper we touched the topic of leverage very briefly. The determinants of leverage for SWF and any other company will be very different and the classical capital structure theory might need substantial adjustment here. In fact, even between different types of SWFs determinants of leverage will likely be different. Development of an optimal leverage framework can be of great importance. Still no research at all has been conducted in this direction.
Given the growing importance and role of SWFs in modern economy and still ununiform regulatory and governance framework among SWFs, exploring all these and other issues might be very useful for governments and fund managers as well as for the general public. In the final analysis SWFs are managing taxpayers' money in the interests of taxpayers – either in the form of economic development or in the form of wealth preservation.
References
Amar, J., Carpantier, J.-F., & Lecourt, C. (2017). Cross-border majority investments of GCC sovereign wealth funds: A threat for the economy?
Beck, R., & Weber, S. (2011). Should larger reserve holdings be more diversified? International Finance.
Bernstein, S., Lerner, J., & Schoar, A. (2013). The investment strategies of sovereign wealth funds. Journal of Economic Perspectives, 27(2).
Bertoni, F., & Lugo, S. (2013). Testing the strategic asset allocation of stabilization sovereign wealth funds. International Finance, 16(1).
Bodie, Z., & Brière, M. (2014). Optimal asset allocation for sovereign wealth funds: Theory and practice. Bankers, Markets & Investors, (128).
Braunstein, J. (2018). Domestic sources of twenty-first-century geopolitics: Domestic politics and sovereign wealth funds in GCC economies. New Political Economy, 23(3).
Campbell, J. Y., & Ammer, J. (1993). What moves the stock and bond markets? A variance decomposition for long-term asset returns. The Journal of Finance, 48(1).
Das, U. S., Mazarei, A., & van der Hoorn, H. (2010). Economics of Sovereign Wealth Funds. International Monetary Fund.
Dyck, I. J. A., & Morse, A. (2011). Sovereign wealth fund portfolios. Chicago Booth Research Paper No. 11-15, MFI Working Paper No. 2011-003, Rotman School of Management Working Paper No. 1792850.
Fattah, Z., & Martin, M. (2024, April 5). Saudis scale back ambition for $1.5 trillion desert project Neom. Bloomberg.
Fidora, M., & Beck, R. (2008). The impact of sovereign wealth funds on global financial markets. Intereconomics: Review of European Economic Policy, 43(6).
Flyvbjerg, B., Bruzelius, N., & Rothengatter, W. (2007). Megaprojects and Risk. Cambridge University Press.
Fotak, V., Bortolotti, B., & Megginson, W. (2008). The financial impact of sovereign wealth fund investments in listed companies.
Gintschel, A., & Scherer, B. (2008). Optimal asset allocation for sovereign wealth funds. Journal of Asset Management, 9(3).
Halland, H., Gelb, A., Tordo, S., Arfaa, N., & Smith, G. (2014). Sovereign wealth funds and long-term development finance: Risks and opportunities. World Bank Working Paper.
Ibbotson, R. G., & Chen, P. (2002). Stock market returns in the long run: Participating in the real economy.
Irarrazabal, A. A., Ma, L., & Parra-Alvarez, J. (2023). Optimal asset allocation for commodity sovereign wealth funds. Quantitative Finance, 23(3).
Kotter, J., & Lel, U. (2011). Friends or foes? Target selection decisions of sovereign wealth funds and their consequences. Journal of Financial Economics, 101(2).
Laeven, L., & Chhaochharia, V. (2008). Sovereign wealth funds: Their investment strategies and performance. CEPR Discussion Papers No. 6959.
Megginson, W., You, M., & Han, L. (2013). Determinants of sovereign wealth fund cross-border investments. Financial Review, 48(4).
Milano, G. V., Whately, R., Tomlinson, B., & Yiğit, A. (2021). A deeper look at the return on purpose: Before and during a crisis. Journal of Applied Corporate Finance, 33(2).
Naser, H. (2016). The role of the Gulf Cooperation Council's sovereign wealth funds in the new era of oil. International Journal of Economics and Financial Issues, 6(4).
Nugent, J. B., & Bazoobandi, S. (2017). Political economy of sovereign wealth funds in the oil exporting countries of the Arab region and especially the Gulf. Working Papers 1143, Economic Research Forum.
Magid, P., Saba, Y., & Tanios, C. (2024, March 7). Saudi Arabia doubles sovereign fund's stake in Aramco. Reuters.
Scherer, B. (2009). A note on portfolio choice for sovereign wealth funds. Financial Markets and Portfolio Management, 23(1).
SWF Global (2024). Annual Report 2024, State-Owned Investors Powering Through Crises